A study-style management framework
TCB™
THECORPORATE BODY
A Framework for Dynamic KPIs, Department-Level Rewards, and Fairer Performance Management
ABDULLAH ALZAMILRevised Professional Edition · 2026
Al Zamil · Elevate your business

“A company should not reward people by forcing them into a bell curve. It should reward departments based on their real contribution to the company’s products — just as the human body distributes energy to its organs based on what the body is doing.”A company is a body. Departments are organs. Products are activities. Rewards are calories. KPIs are vital signs.
How to read this interactive edition
Every chapter of the book is here, condensed for the screen, with the original figures. Fourteen working tools sit inside the chapters: the reward formula, the weight-setting protocol, the Health Gate register, the credit-card case and more. Each chapter ends with its key takeaways, the book's questions for reflection and a short check-your-understanding quiz. Your progress is saved in this browser.
The five parts
Choose your reading path
From Appendix K. Pick your role to see where to start.
Front matter
Foreword & A Note to the Reader
Why reinventing the vocabulary of performance is easy, and reinventing what we feed is hard.
Every few years, a company announces that it is reinventing performance management. The vocabulary changes: competencies become outcomes, ratings become check-ins, the annual review becomes continuous feedback. Yet the lived experience of most employees barely moves. People still feel that reward is rationed, that visibility beats contribution, and that a hidden curve has already decided who will be celebrated long before the work is counted.
The argument takes an unusual route to a practical destination. It borrows a lens from human biology: a living body distributes energy to its organs according to what the body is doing, not according to which organ is largest or loudest. A sprinter’s legs are fed differently from a reader’s eyes. A healing wound draws resources a resting limb does not.
What makes the metaphor useful is structure, not poetry. Departments are treated as organs, products as activities, rewards as the calories that follow real demand, and Health Gates stop any organ from consuming the body to feed itself. From that model come tools you can use: a contribution matrix, a reward formula, departmental scorecards and a governance design, all illustrated with a banking credit-card case study.
“Reinventing the vocabulary of performance is easy. Reinventing what we choose to feed is the harder, more honest work.”
A note to the reader
This is a proposal, not a proof. TCB™ is offered as a study-style hypothesis to be piloted, stress-tested and corrected. Read it the way an engineer reads a blueprint: looking for what will bear load, what must be reinforced and what should be redrawn.
The book is critical of forced distribution, but it is not anti-performance and not anti-measurement. It argues for better differentiation: differentiation that follows real contribution and protects the health of the organisation, rather than differentiation forced into a predetermined curve.
Front matter
Scope, Measurement, and Compensation Readiness
The boundary that keeps a memorable metaphor from becoming an ungoverned pay decision.
TCB™ has two distinct layers. Keeping them apart is the single most important rule in the book.
| Communication layer | Measurement layer |
|---|---|
| Organ map and body language | Dynamic Contribution Matrix |
| Explains specialised roles and interdependence | Defines product-stage outcomes and their importance |
| Makes hidden functions easier to discuss | Classifies Value Creation, Value Protection, Criticality/Continuity and Enabling Capacity |
| Creates a memorable common language | Attributes, normalizes, scores, gates, reconciles and audits |
| May vary by organisation | Must be reproducible from evidence and governed rules |
The metaphor communicates. The matrix makes the allocation rules explicit. An organ label explains a role; it never creates a compensation weight.
Primary use case
The primary application is the allocation of a finite variable reward pool. Promotions, headcount, training budgets and formal recognition are possible research extensions, not established applications. Each would need its own legal, ethical, operational and fairness safeguards.
Live-pay boundary
Conceptual simulations may begin with assumptions and imperfect data. A shadow pilot may run in parallel with the existing reward system. A real-pay pilot is different: it must not begin until the data, calculation, governance, legal, payroll, employee-relations, privacy, risk, audit and pay-equity conditions in Chapters 12–13 and Appendix M have passed.
Front matter
Executive Summary
The problem, the proposal, and the single formula at the heart of the model.
Many companies still force employees into a predetermined distribution. In a small team this can mean only one person may receive the top rating, most must sit in the middle, and at least one may be placed at the bottom even when the team has no real underperformer. The results are demotivation, internal politics, unhealthy competition, weak collaboration and a slow erosion of trust.
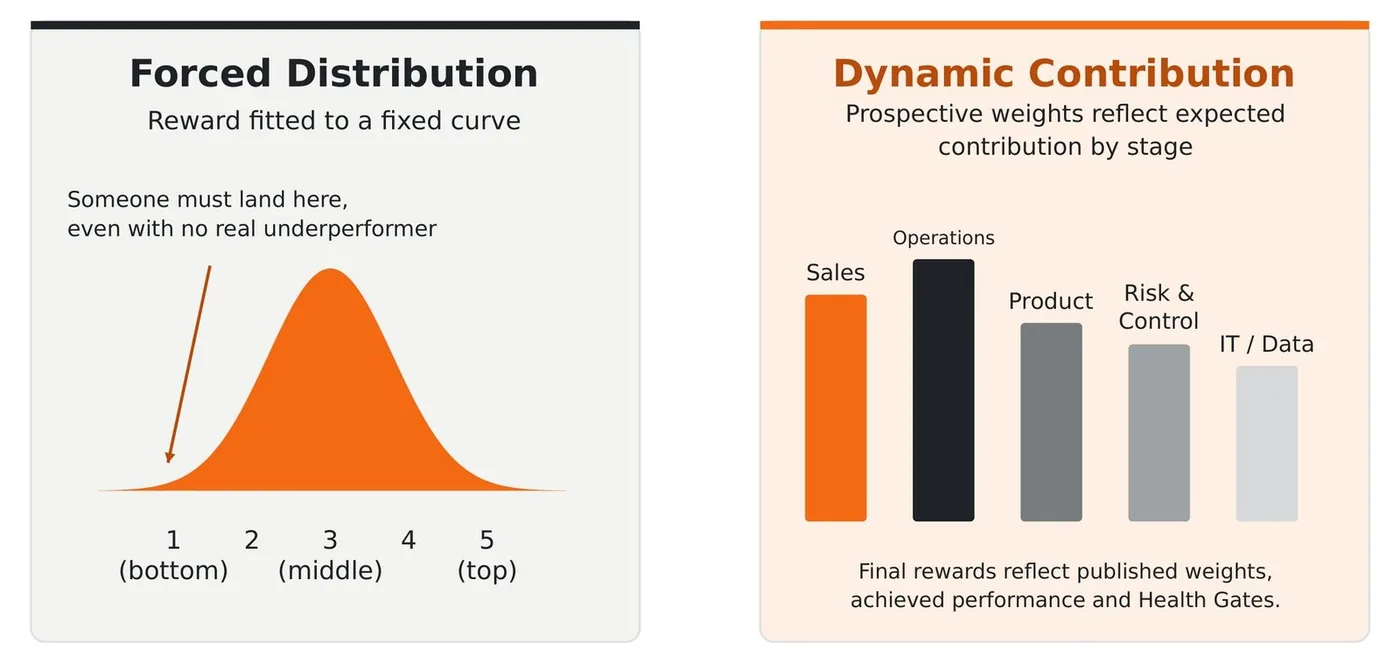
TCB™ proposes a different approach. Before the period, the company approves a finite funding allocation and departmental weights for expected contribution to each product and stage. After the period, achieved performance and Health Gates determine awards within the published departmental ceilings.
Cap the department’s performance amount first, apply its own gate, then round the final amount down. Unused capacity and deductions remain unpaid. Try it yourself in Chapter 8’s reward calculator.
A company should not assume that reward follows headcount. A small department may have a material expected role; a large one may be essential to reliable delivery. Product-stage evidence, not size or anatomy, informs the allocation.
The shift in one sentence
The safeguards are deliberate. A department should not be rewarded for cutting too many people, creating burnout, increasing risk, damaging customers, hiding errors or gaming metrics. The Health Gates are what separate the model from a disguised cost-cutting exercise.
The main tools
- The Organ-to-Department Map
- Department headcount and reward-share diagnostics
- The Product Lifecycle Map
- The Dynamic Contribution Matrix
- The reward calculation with Health Gates
Their intended benefits are transparency, adaptability and contribution-based fairness. Those benefits require testing: an explicit calculation makes a policy inspectable, not automatically fair.
Part I · Chapter One
The Problem with Traditional KPIs and Bell Curves
How forced distribution quietly replaces the truth of performance with the shape of a curve.
Imagine you manage a team of ten. The objectives were clear and the team delivered; many did more than expected. Then the year-end cycle begins and you are told you cannot rate everyone on their actual performance. Maybe only one person can receive five out of five. Maybe two can receive four. Most must receive three, and at least one may need a two, even if that person was not truly an underperformer.
“The manager is no longer evaluating performance. The manager is fitting people into a pre-decided shape.”
Your team of ten vs. the forced curve
Set how your ten people actually performed. The quota stays fixed: one 5, two 4s, six 3s, one 2. Watch who gets pushed down.
Bonus multiples from the book’s illustration: 5/5 = 10×, 4/5 = 7×, 3/5 = 4×, 2/5 = no bonus.
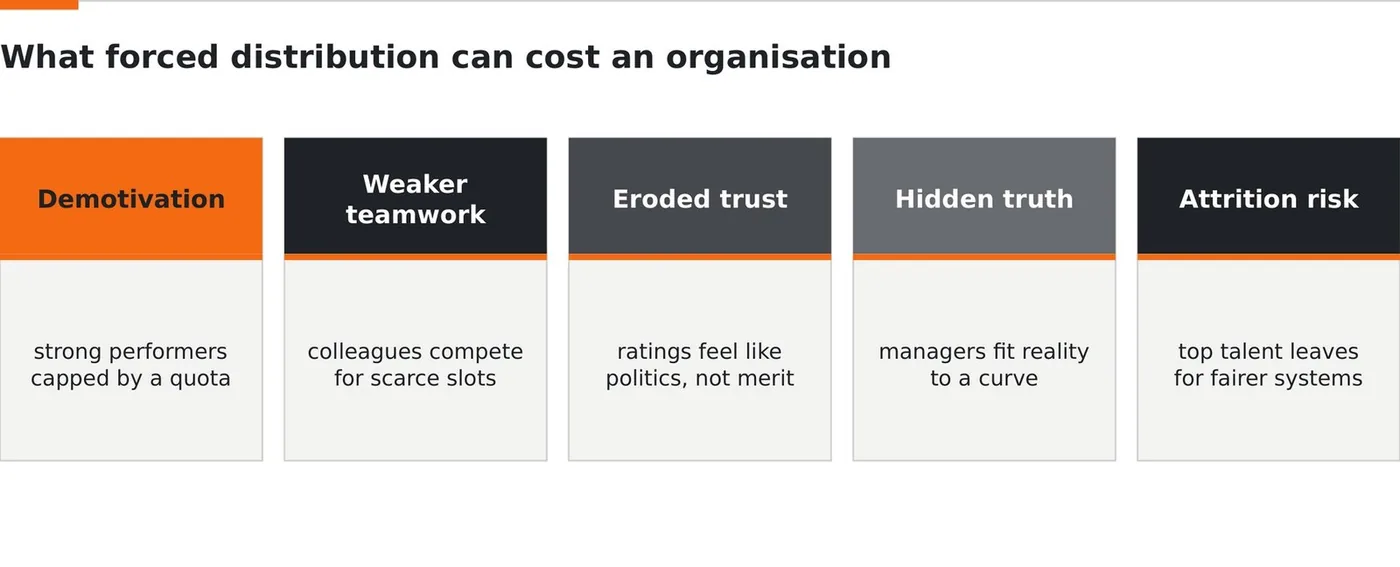
The curve was built for a different type of work
The bell curve assumes performance spreads naturally: a few excellent, a few poor, most average. Height works this way. Performance inside a company often does not. A small team can be full of strong performers; a department can have no serious underperformer in a given year. Structured rating practices trace back to early twentieth-century military and industrial settings (SHRM, 2024), where work was individual, supervised and repetitive. Today an operations analyst affects sales, a risk officer protects future revenue, and an engineer enables retention. Work is networked, yet many reward systems still measure people as if it were isolated.
Differentiation is not the problem
Supporters of forced ranking are right that companies must differentiate, cannot reward everyone equally and must face poor performance. The issue is forced differentiation. “Some people performed better than others this year” is performance management. “No matter what happened, this percentage must be excellent and this percentage poor” is statistical control. Microsoft ended its stack-ranking system in 2013 (SHRM, 2013).
The impact on motivation and collaboration
A reward system sends a message about what the company values. If only a few can win regardless of team results, people stop helping colleagues who might take the rating they need. They hoard knowledge and compete for visibility. Gallup (2019) reports that only a small minority of employees strongly agree that reviews motivate them to improve. A forced curve manufactures artificial scarcity, and punishing a team for being strong is a failure of system design.
Why existing alternatives have not solved it
Continuous feedback, 360-degree reviews, OKRs and removing ratings are real improvements (Cappelli & Tavis, 2016; Buckingham & Goodall, 2015). But none explains how rewards should be shared fairly when different departments contribute differently at different times. That is the question this book attempts to answer.
The missing link: contribution changes over time
In a bank selling credit cards, sales leads in acquisition. Once the card is sold, value depends on operations, customer experience, fraud, IT, product and finance. Why should the same reward logic apply in year one and year two? Most systems reward the visible moment, not the full lifecycle.
What the curve gets right
It forces managers to differentiate, it controls reward budgets and it creates a consistent story across a large organisation. Any replacement must answer differentiation, affordability and consistency. TCB™ answers with evidence-informed prospective weights, a funded pool with fixed departmental ceilings, and common governance rules.
Table 1.1 — Five hidden costs of a forced curve
| Hidden cost | How it arises | What leaders eventually see |
|---|---|---|
| Talent flight | Strong performers are capped or rated down to fit the shape | Quiet attrition of the best people |
| Collaboration tax | Colleagues compete for a fixed number of top slots | Hoarding and reduced knowledge-sharing |
| Manager disengagement | Ratings dictated by distribution, not judgement | Reviews treated as a compliance chore |
| Risk concealment | Admitting a problem lowers a rating | Late discovery of issues |
| Short-termism | Reward follows visible wins, not durable value | Under-investment in maintenance and renewal |
Operating clarification: a finite pool is not a forced curve
TCB™ does not claim money is unlimited. Contribution weights total 100% so the same currency is not allocated twice. That is a funding constraint, not a forced distribution of human performance.
| Dimension | Forced rating distribution | TCB™ finite-pool allocation |
|---|---|---|
| What is fixed | The proportion of people in rating bands | The funding base and maximum payable ceiling |
| What evidence may show | Evidence is reshaped to fit the curve | Every department may meet or exceed target |
| How scarcity is controlled | Limits on top ratings | Fixed departmental ceilings within a funded budget |
| Below target | Someone may still have to occupy a band | Unearned amounts normally remain unpaid |
| Above the ceiling | Ratings are compressed or capped | Each department is capped at its own ceiling before its Health Gate |
Table 1.2 — The forced curve and the Corporate Body, side by side
| Dimension | Forced curve | TCB™ model |
|---|---|---|
| Unit of comparison | Individuals against each other | Departments against contribution |
| Shape | Fixed in advance | Emerges from evidence |
| What is rewarded | Relative rank | Healthy contribution to products |
| Budget control | Quota on top ratings | Explicitly funded pool |
| Response to change | Static year to year | Recalibrated by lifecycle |
| Treatment of harm | Largely invisible | Discounted by Health Gates |
| Transparency | Outcome often opaque | Weights and logic published |
The shift replaces the question “why did the curve put me there?” with a better one: “what did my part of the business contribute, and how was that measured?”
✔ Key takeaways
- Forced distribution can make the curve more important than the truth of actual performance.
- Reward systems teach behaviour; artificial scarcity damages collaboration and trust.
- Contribution changes by product and lifecycle stage, yet most systems treat it as fixed.
- A new model is needed to connect rewards with measurable contribution over time.
? Questions for reflection
- In your last performance cycle, did the ratings describe reality, or did reality have to be reshaped to fit the ratings?
- Where in your organisation is excellence treated as scarce when it may actually be common?
- Which departments create value long after the “visible moment” of a sale, and are they rewarded for it?
Part II · Chapter Two
Anatomy of the Human Body: Weight, Energy, and Purpose
Why a small organ can demand enormous energy, and what that teaches us about rewarding departments.
In a healthy body, size, purpose and energy consumption are related, but they are not the same thing. Some organs are small yet energy-intensive. Some tissues are large yet less demanding at rest. Some systems become active only during certain activities. And organs must stay within a healthy size range. These four ideas are the foundation of TCB™.
Organ weight is not organ importance
Grey bar: approximate share of body weight. Orange: the energy logic from Table 2.1. Select an organ.
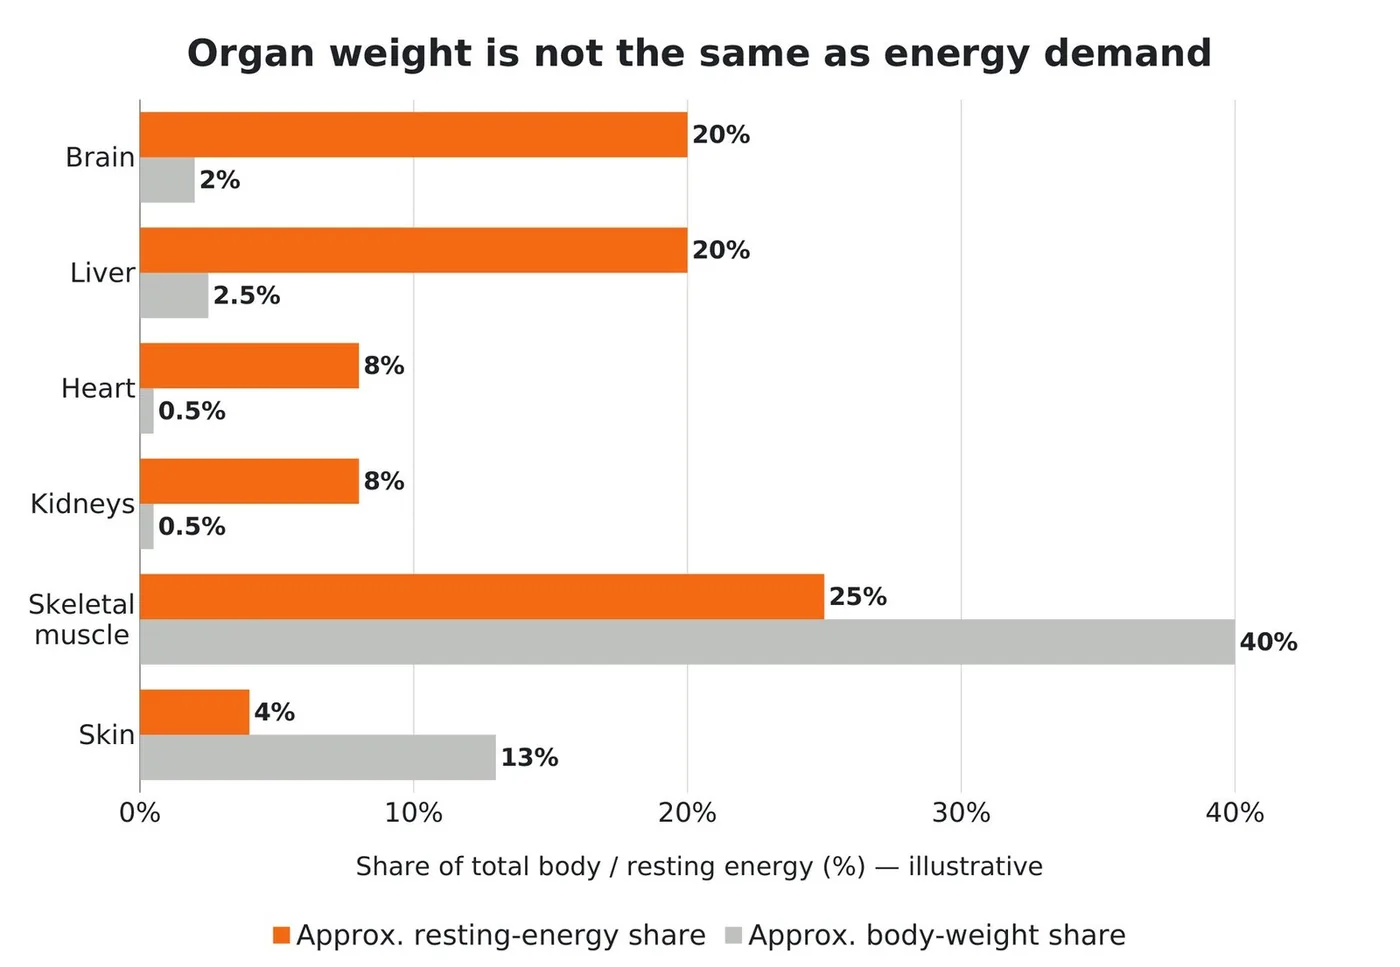
Raichle and Gusnard (2002) describe the adult brain as roughly 2% of body weight while accounting for about 20% of oxygen and calorie consumption. The liver is far heavier and performs hundreds of functions; the skin is the largest organ of all. A body cannot be understood by weight alone. Its organs do not compete to be the same; they succeed by being different. Finance should not be judged as if it were sales, and risk should not be measured as if it were customer service.
Energy consumption is dynamic
During running, muscles demand more energy, the heart pumps harder and the lungs ventilate more. During digestion the gut becomes active; during sleep, repair dominates. A company launching a product is not in the same internal state as one servicing existing customers, so reward distribution should not be fixed either.
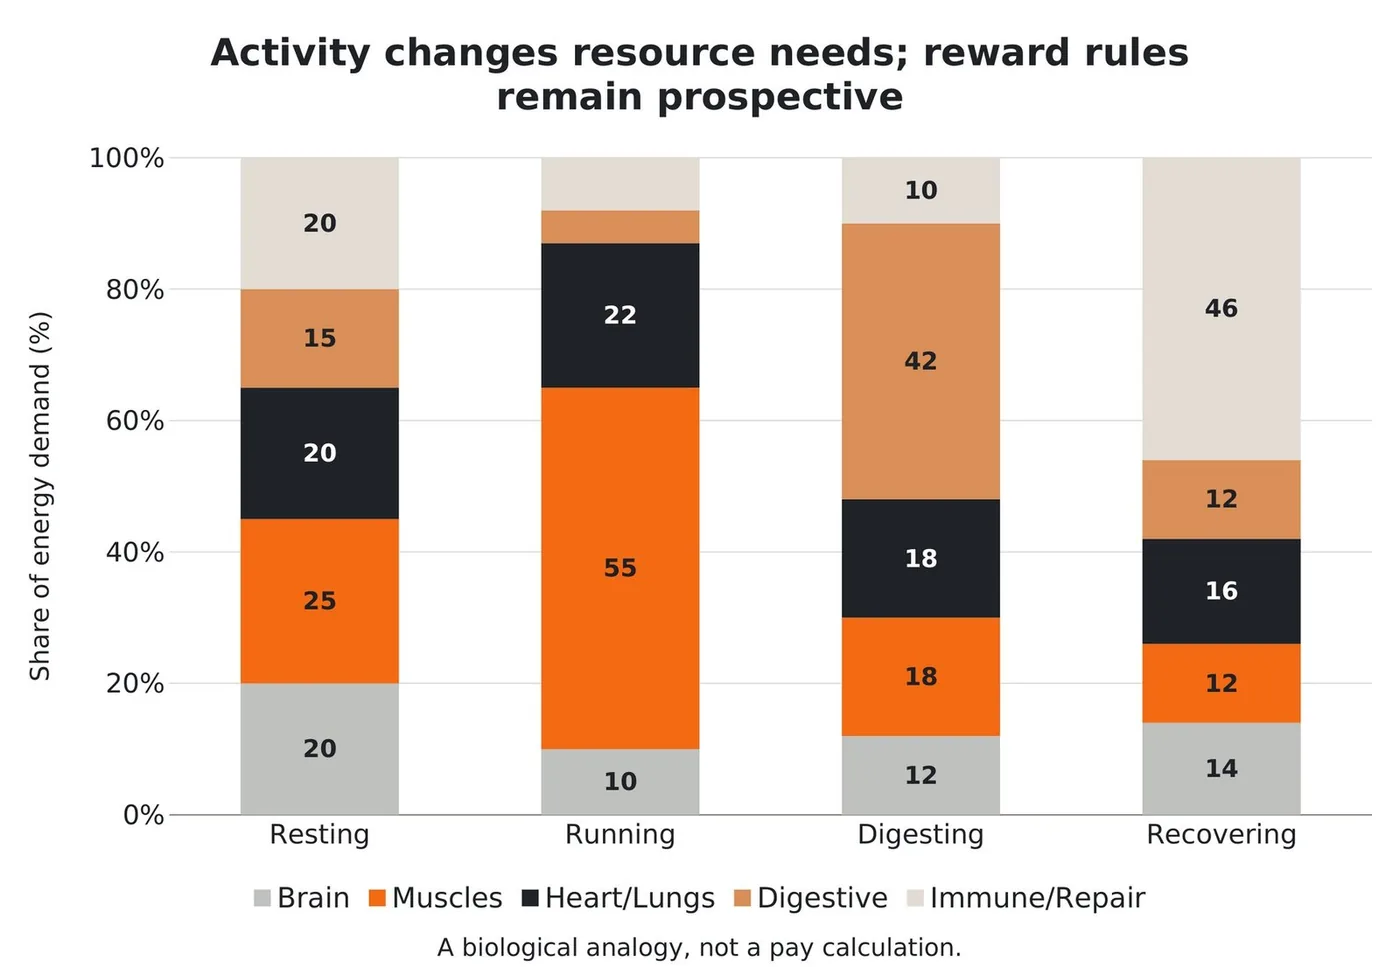
The child body and the startup
Brain glucose use peaks in childhood (Kuzawa et al., 2014) and during development the brain may account for up to 60% of basal energetic requirements (Steiner, 2019). A startup likewise carries a heavier leadership and product-development burden than a mature firm: it needs energy for development, not only maintenance.
Healthy organs are right-sized
An enlarged heart can signal strain (Cleveland Clinic, 2022). A department that grows larger is not automatically healthier. Growth can be necessary, or it can be a symptom of manual work, duplication or unresolved risk.
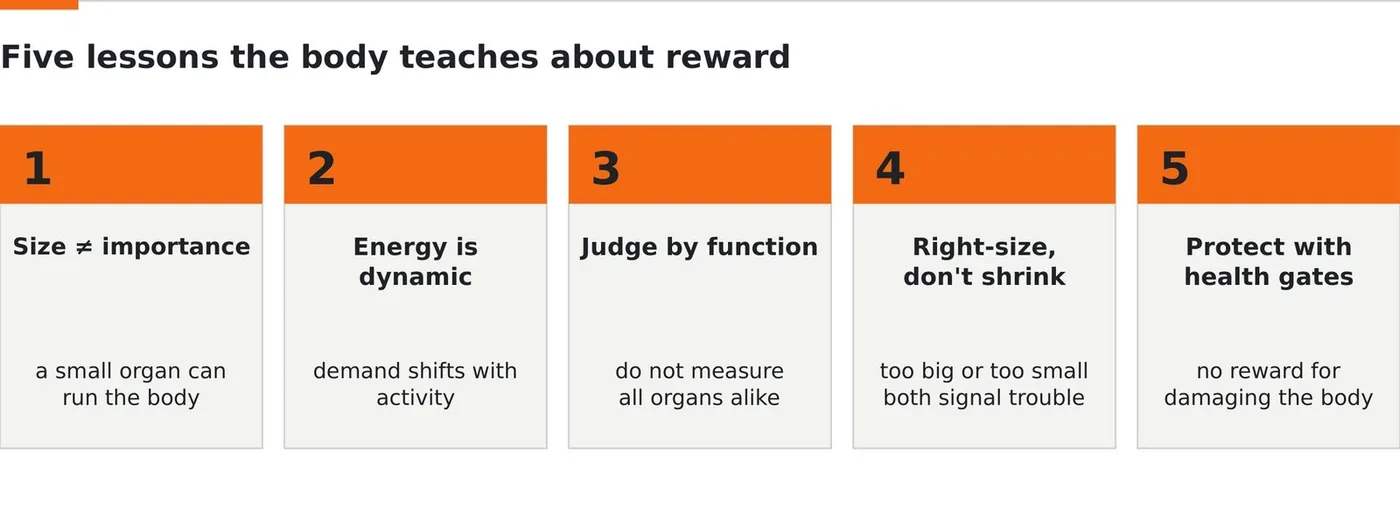
- Size does not equal importance. A small function can carry decisive value.
- Energy depends on purpose and activity. Need changes with what the body is doing.
- Different organs are judged by different functions. Each has its own measure of success.
- Healthy systems keep organs right-sized. Growth and shrinkage both carry meaning.
- Allocate dynamically, but protect health. Flexibility without protection becomes harm.
Companies are full of brains
A small treasury team managing liquidity, a handful of model-risk specialists, a compact architecture group: each is tiny in headcount and outsized in consequence. A bell curve, which implicitly rewards the visible and numerous, tends to overlook them. The right question is the one the body answers automatically: what does this organ do, how much does the body depend on it now, and is it doing that work well?
Table 2.2 — Energy patterns across body states
| Body state | Organisational parallel | Resource and reward distinction |
|---|---|---|
| At rest | Business as usual | Fund maintenance capacity; recognise continuity contribution prospectively. |
| At work | Launch, peak season, growth push | Plan extra capacity and contribution weights before the period. |
| Under threat | Incident, breach, remediation | Provide urgent resources; use published exceptional-change and independent-control rules for pay. |
| In recovery | Post-crisis stabilisation | Restore capacity; do not treat a reward share as a staffing budget. |
Basal metabolism, homeostasis and reserves
Basal metabolism is the cost of staying alive. Security, finance, compliance and core platforms look like overhead in good times and are catastrophic when starved. They must be recognised without being paid twice.
| Situation | Treatment |
|---|---|
| Product-specific baseline contribution | An explicit continuity-and-viability outcome inside the product matrix |
| Enterprise-wide, not credibly attributable to products | A separate enterprise reward pool with its own matrix, gates and ceiling |
| Independent control work | The independently funded and governed control route, even when product-attributable |
| Could fit more than one route | Choose and document one route before the period |
One contribution, one reward route. Never pay both.
Homeostasis holds the body in balance through continuous feedback. Companies should monitor continuously but recalibrate prospectively: ordinary weight changes take effect next period. Energy reserves matter too. Spare capacity, training and a bench of people who can step up are real contribution, even with no output this quarter. A body without reserves does not survive its first hard winter.
✔ Key takeaways
- Organ weight and organ importance are not the same thing.
- The body allocates energy dynamically according to purpose, activity and survival.
- Healthy size matters: right-sizing is about balance, not blind cost-cutting.
? Questions for reflection
- Which of your departments is a “brain”, small in headcount but large in influence on outcomes?
- Where has departmental growth been healthy adaptation, and where has it masked inefficiency?
- What would “right-sized” look like for the function you know best?
Part II · Chapter Three
The Company as a Living Body
Trading the language of machines for the language of living systems, and why it changes the reward conversation.
Leaders talk about engines, levers and pipelines. Machines are designed for fixed tasks; they do not heal, adapt, learn, feel stress or build trust. Companies do. Instead of a machine controlled through fixed rankings, TCB™ sees the organisation as a living system to be nourished, balanced, protected and directed.
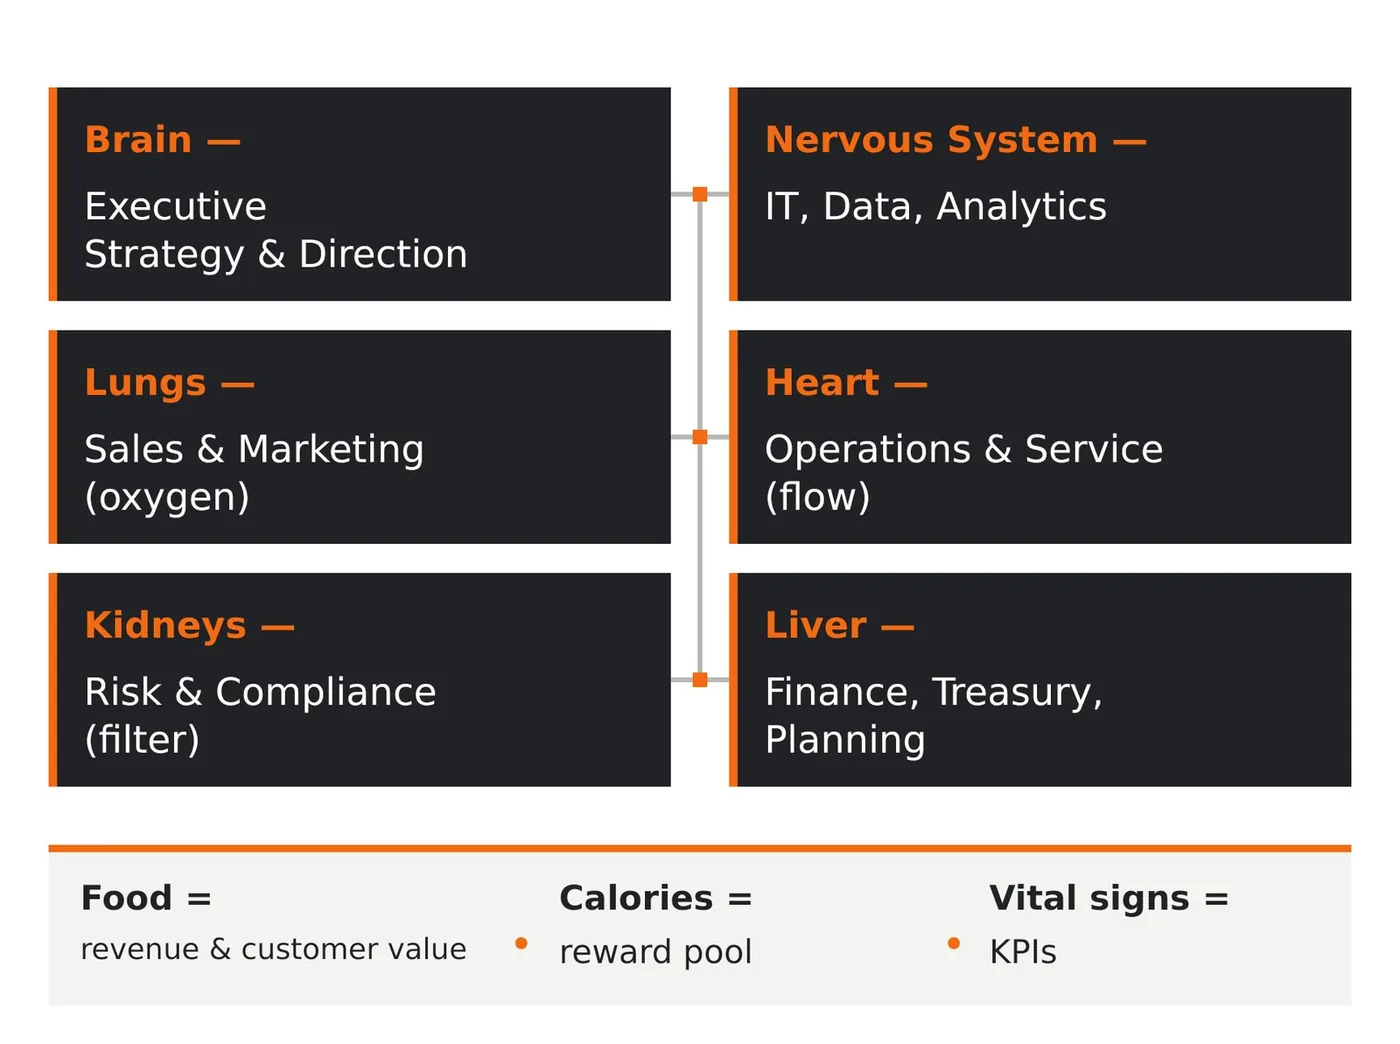
Table 3.1 — Translating the body analogy into business language
| Body concept | Company concept |
|---|---|
| Food and nutrients | Revenue, profit, capital, customer value, strategic funding |
| Calories / energy | Variable reward pool (primary application) |
| Organs and systems | Departments and functions |
| Organ weight | Department headcount or cost base |
| Organ energy use | Department reward share based on contribution |
| Body activity | Product, service, project, market cycle or lifecycle stage |
| Vital signs | KPIs, risk, quality and customer indicators |
| Health condition | Sustainable performance and culture |
“Different contributions require explanation. Fairness requires evidence and review.”
The Corporate Body is product-based
TCB™ does not begin by asking “which employee deserves the highest rating?” It begins with: which product are we rewarding, which stage is it in, and which departments created value at that stage? That moves the discussion away from subjective individual comparison toward contribution mapping.
Where the metaphor breaks down
The body’s allocation is involuntary and instant; a company’s is deliberate, political and slow. The body has one objective, survival; a company balances many. And organs cannot misreport their activity; departments can. So the model adds deliberately what biology supplies for free: governance because allocation is a human decision, Health Gates because objectives compete, and evidence because departments can overstate their contribution.
Table 3.2 — The body’s systems and their company equivalents
| Body system | Role in the body | Company equivalent |
|---|---|---|
| Muscular | Produces movement and work | Operations and delivery |
| Circulatory | Distributes energy, clears waste | Cash and funding flows |
| Nervous | Senses, decides, coordinates | Data, reporting, decisions |
| Immune | Defends against threats | Risk, compliance, security |
| Skeletal | Gives structure and protection | Governance and framework |
| Metabolic | Converts intake into energy | Turning value into reward |
| Endocrine | Regulates and balances | Policy and incentives |
Reward requires an approved, affordable pool. Before the period the organisation fixes the funding amount using a disclosed budget, forecast or prior-period basis; it does not substitute realised value after results are known. Connective tissue, the trust and shared purpose that let structure function, matters as much as the formulas.
✔ Key takeaways
- A company can be understood as a living system with organs, energy, flow, protection and repair.
- Revenue, profit and customer value are the food; rewards are the calories distributed to active organs.
- The model rewards contribution while protecting the health of the whole company.
? Questions for reflection
- Does your organisation talk about itself as a machine or as a living system, and how does that shape its reward decisions?
- For one important product, which stage is it in right now, and which organs are most active?
- Where might “efficiency” already be quietly damaging an organ?
Part III · Chapter Four
Mapping Departments to Organs
A shared map of who does what, organised by function rather than job title.
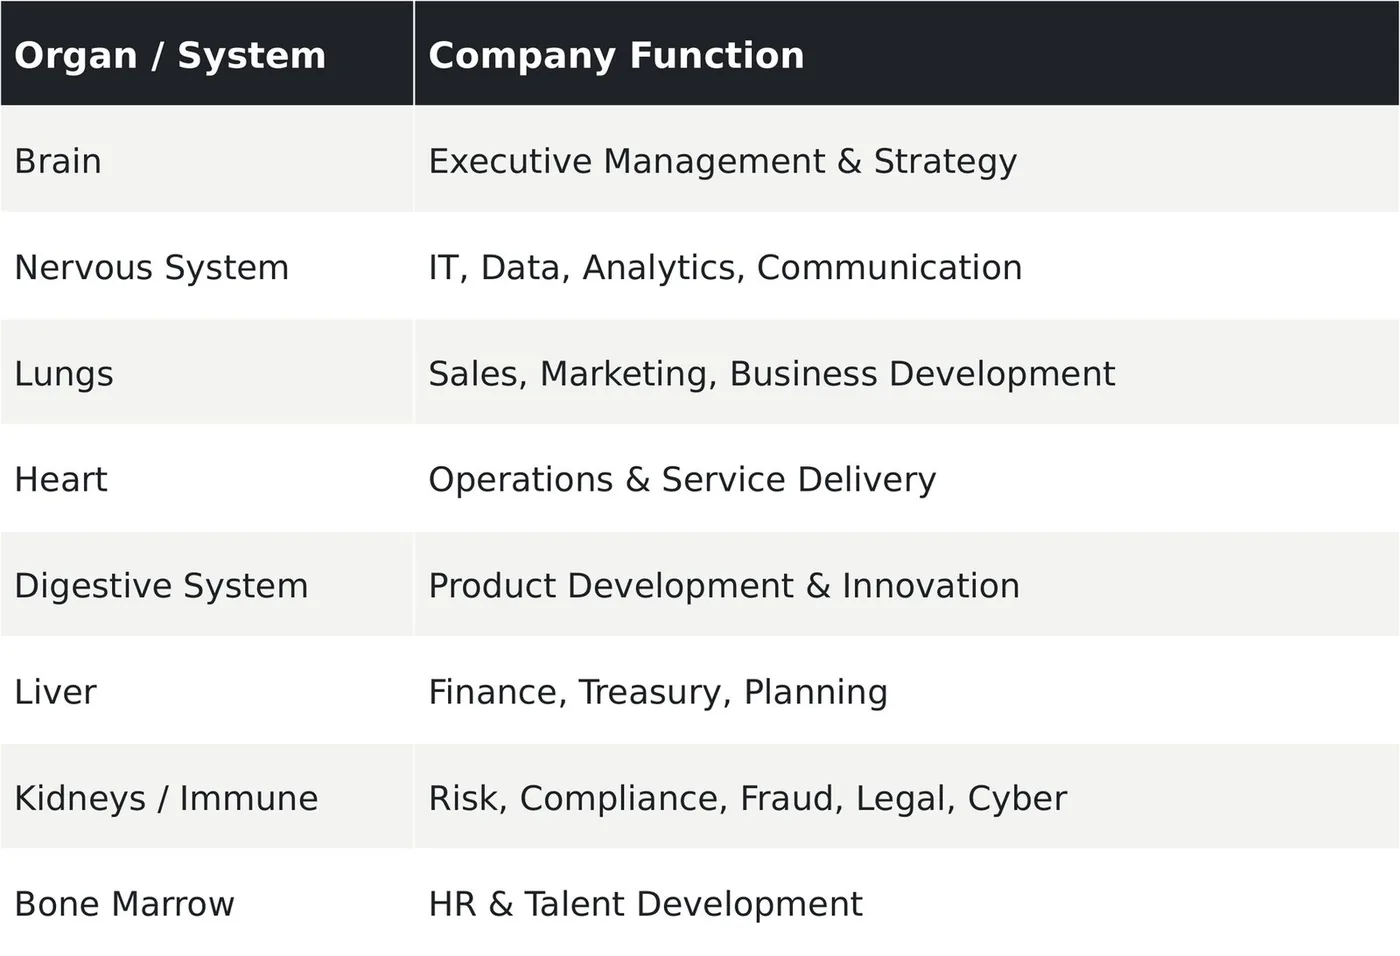
The purpose of the mapping is educational clarity, not scientific perfection. It helps employees understand each department’s function, the type of contribution it makes, and why its reward share may change with the product or activity. Map by function: in one company customer service sits under operations, in another under customer experience. The organ follows what the department actually does.
The Organ-to-Department Map (Table 4.1)
Boundary: the map explains roles. No organ label appears in the weight calculation. When metaphor and evidence disagree, evidence governs.
Why HR is bone marrow, not skin
Earlier versions of the analogy placed HR as the skin. The book proposes a stronger mapping: bone marrow creates and renews blood cells; HR creates and renews the company’s people system through hiring, onboarding, learning, succession and capability building. HR should be measured by talent quality, time to capability, critical-role retention, leadership development and employee health.
When a department resists its place on the map
Separate two ideas: importance over the life of the business and contribution to a particular activity right now. A control function is permanently important and may still carry a modest weight during a launch, just as the immune system is vital yet quiet while the body sprints. No one is being told they do not matter; they are being told what the body is doing this quarter.
People who belong to many organs
Shared functions need two records: evidence-based attribution sets each function’s weight in each product matrix, and participation records show which employees support each product. An effort split is not itself a contribution weight. Allocate within each department-product pool before summing, so the same effort is never credited twice.
Table 4.2 — Mapping common support functions
| Support function | Body parallel | How to attribute its contribution |
|---|---|---|
| Finance & treasury | Liver / metabolism | Across products by capital and risk supported |
| Data & analytics | Nervous system | Across products by decisions and models served |
| Security & platform | Skin / immune system | Across products by exposure protected |
| HR & talent | Bone marrow | Across products by critical roles staffed |
| Legal & compliance | Immune system | Across products by regulatory load carried |
The map is not the org chart
The org chart shows who manages whom; the organ map shows what role each part plays in keeping the body alive. Because weights follow function rather than reporting lines, a reorganisation changes the chart without necessarily changing the map.
A step-by-step mapping method
- List the product’s major activities in its current lifecycle stage.
- For each activity, identify which functions do the work, ignoring reporting lines.
- Group functions into organs by role: acquisition, operation, protection, repair.
- Note where a function supports several activities and record the split.
- Test the map: would removing each organ visibly harm the activity it serves? If not, the mapping is wrong.
- Record a one-line rationale for each organ so it can be challenged next cycle.
Table 4.3 — Common mapping mistakes
| Mistake | Why it distorts | Fix |
|---|---|---|
| Mapping by org chart | Rewards structure, not contribution | Start from activities, then find the functions |
| One person, one organ | Hides shared contribution | Attribute effort across activities supported |
| Ignoring support functions | Underpays diffuse, shared value | Attribute platform value explicitly |
| Freezing the map | Drifts from reality | Review when products are added or retired |
| Mapping aspiration | Rewards intent, not work done | Map what the function actually does now |
✔ Key takeaways
- Departments should be mapped by function, not by job title or organisational label.
- Each organ-department has a distinct role in growth, flow, protection, repair or renewal.
- The map is a communication tool that helps employees understand why rewards shift by activity.
? Questions for reflection
- If you mapped your own organisation by function, where would the labels surprise people?
- Which “nervous system” dependencies would halt the business within hours if they failed?
- Is HR treated as administration or as bone marrow, and what would change if it were the latter?
Part III · Chapter Five
Weight Ratio vs. Calorie Ratio
Three different questions: how large is the department, what share of final awards did it receive, and what value can credibly be attributed to its work?
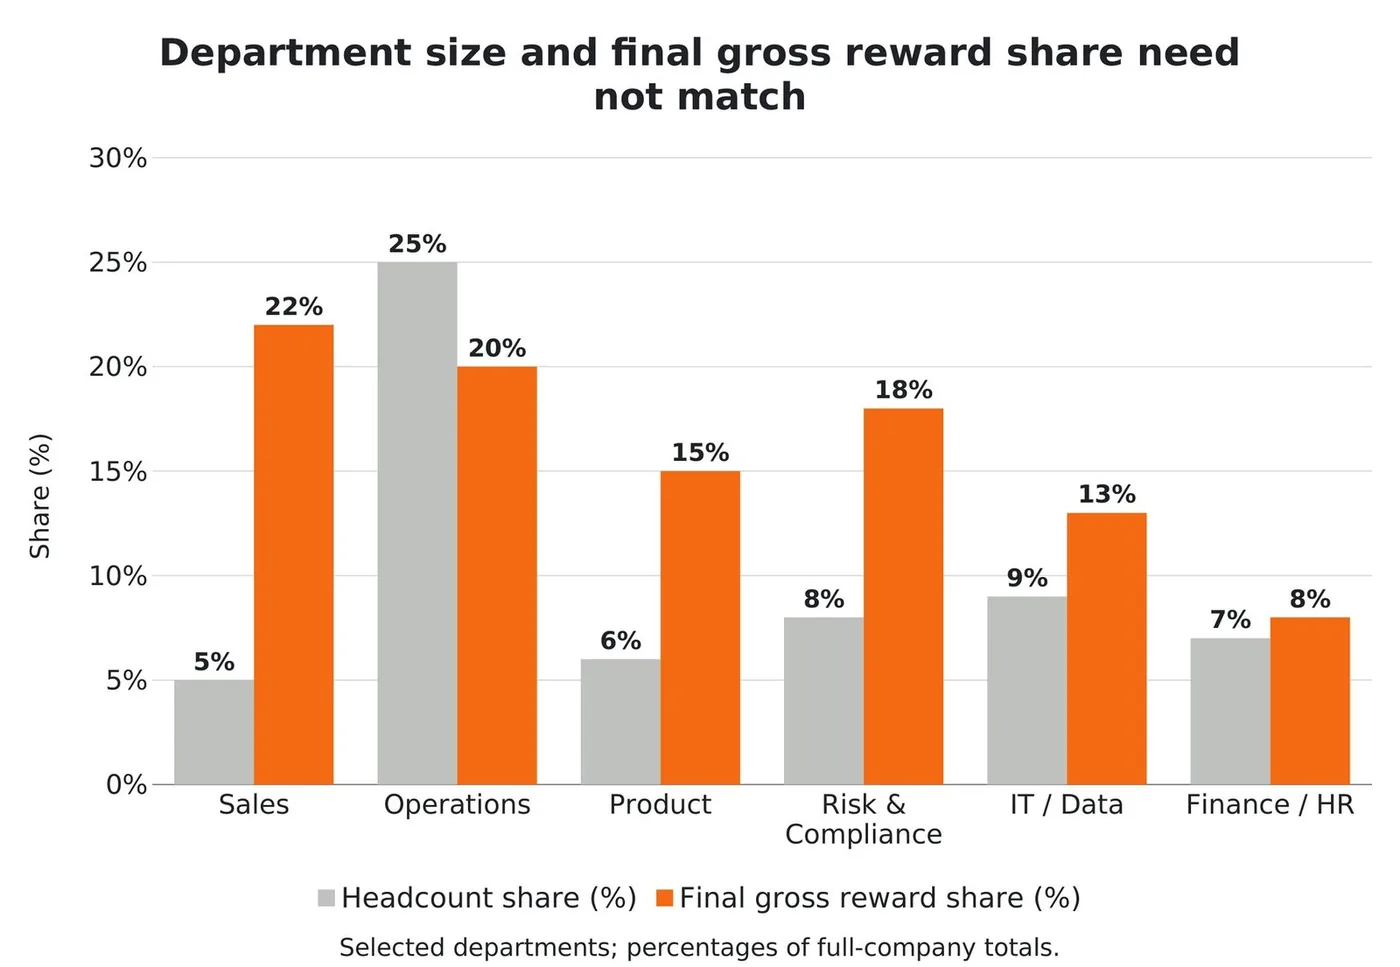
Headcount share, prospective contribution weight and final gross reward share are separate quantities. A department’s share of employees does not determine its weight, and its final reward share does not establish its economic contribution. The ratios in this chapter are diagnostics.
Value density on a common basis (Table 5.2)
The book’s hypothetical product: 100 million of risk-adjusted value and 500 FTEs. Change any value or FTE and the densities recalculate. Orange marks density above the product average.
| Contributor group | Product FTEs | Value (m) | Value per FTE | vs. average |
|---|
Under the book’s assumptions, Fraud operations has half the value of Operations and one tenth of its FTEs, giving five times the density. That does not determine fair pay or staffing; the canonical weights for these groups are a separate policy (25/20/10/20/25%).
The efficiency principle and its trap
If a department delivers the same verified, healthy value with fewer FTEs, its value density rises and the average reward per person may rise. That does not make smaller teams inherently better. A department can appear to improve by shedding people while essential work is quietly deferred. An organism can lose weight by burning fat, which is healthy, or muscle, which is not, and the scale alone cannot tell the difference.
Table 5.1 — Weight ratio versus calorie ratio, illustrated
| Department | Headcount | Reward share | Question to investigate |
|---|---|---|---|
| Operations | 30% | 22% | Does capacity match workload, service obligations and resilience needs? |
| Sales (mature product) | 18% | 8% | Do stage demands, results or eligibility explain the gap? |
| Fraud operations (first line) | 3% | 12% | What evidence supports the weight and achieved results? |
| Compliance | 6% | 10% | Which independent remuneration rules explain the award? |
| Product | 8% | 12% | How do lifecycle responsibilities and results explain the award? |
Right-sizing without cutting to the bone
The body does not amputate a large muscle because it is expensive. It sizes each organ to the work the organism actually does. Right-sizing works in both directions: a department can be too small for its workload as easily as too large. The reward model is a diagnostic, not a pretext for cuts.
✔ Key takeaways
- Department headcount ratio is not the same as reward entitlement.
- Prospective weights, achieved performance, Health Gates and departmental ceilings jointly govern final reward.
- Density measures and share gaps identify questions; they do not establish staffing needs or entitlement.
? Questions for reflection
- Where in your organisation does headcount quietly drive reward when contribution should?
- Which small team has the highest value density, and is it being recognised or quietly exhausted?
- Before your next reorganisation, how will you diagnose whether a department’s size is healthy?
Part III · Chapter Six
Products as Body Activities
Each product is a different activity (running, resting, digesting) and each draws on a different mix of organs.
A credit card is one activity. A mortgage is another; so are a software subscription, a manufacturing contract and a customer complaint. Each has a different internal energy map. A product-based matrix can make those differences explicit, subject to credible evidence and proportionate administration.
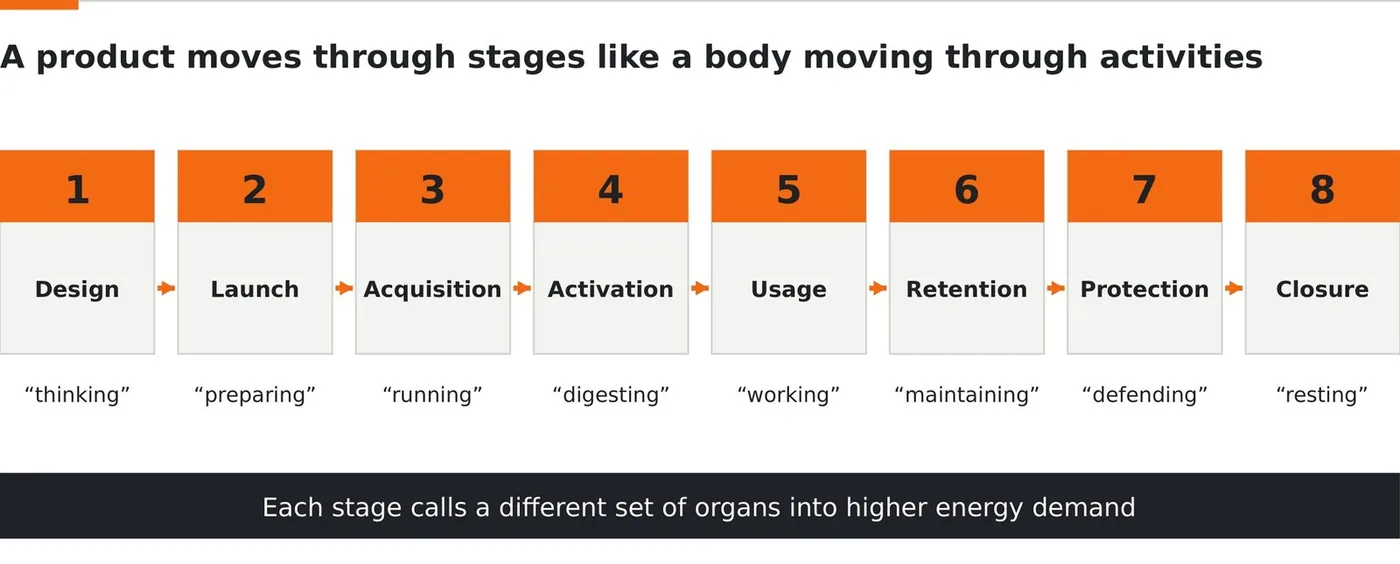
The eight lifecycle stages (Table 6.1)
“Changing stages may change expected contribution. Fair opportunity still needs deliberate review.”
The product owner across the lifecycle
In acquisition the product owner shapes features, pricing, eligibility, journey and channel readiness. In retention they study usage, complaints, profitability and attrition. In protection they adjust product rules with risk and fraud without killing customer value. The product owner should rarely be absent from the matrix: the percentage may change, but the role stays central.
When several products compete for the same calories
The model uses two separate prospective decisions. First, leadership approves funding allocations across products and the enterprise. Then each product matrix sets departmental weights within its own funding. A department that feels underfed now has a clear question to ask: is the product’s overall share too small, or is my share within the product wrong?
Table 6.2 — A portfolio at different stages
| Product | Stage | Dominant organs | Portfolio funding tilt |
|---|---|---|---|
| Product A | Acquisition | Sales, marketing, product | Elevated (growth bet) |
| Product B | Maturity | Operations, CX, risk | Steady |
| Product C | Decline | Operations, risk | Reducing |
| Product D | Renewal | Product, marketing | Elevated (relaunch) |
Seasonality and stage signals
A predictable peak justifies a scheduled, labelled, reversible lift for the functions that carry it, so a seasonal shift is not baked into next year’s baseline. For stage changes, look for sustained, corroborated shifts, several indicators moving together over more than one period, such as slowing new-customer growth and a rising share of revenue from existing customers. Naming those signals in advance turns a stage change into an evidence-based decision rather than an argument.
✔ Key takeaways
- Each product behaves like a different body activity and may need a different energy pattern.
- Acquisition, activation, retention, servicing and protection require different department weights.
- Product owners remain important across the lifecycle, but their role changes by stage.
? Questions for reflection
- Pick one product: what “activity” is it performing this year, and which organs should lead?
- Which lifecycle stage does your current reward system reward most, and which does it ignore?
- Is your product owner present in both the acquisition and the retention conversation?
Part III · Chapter Seven
The Dynamic Contribution Matrix
The central instrument of the model, where analogy becomes a disciplined, evidence-based business tool.
For each product and lifecycle stage, the matrix records expected outcomes, eligible contributors, prospective contribution weights, the KPIs used to assess performance, the Health Gates and the approved reward boundaries. It makes a governed policy reproducible; it does not turn the organ analogy into a measure of causal contribution.
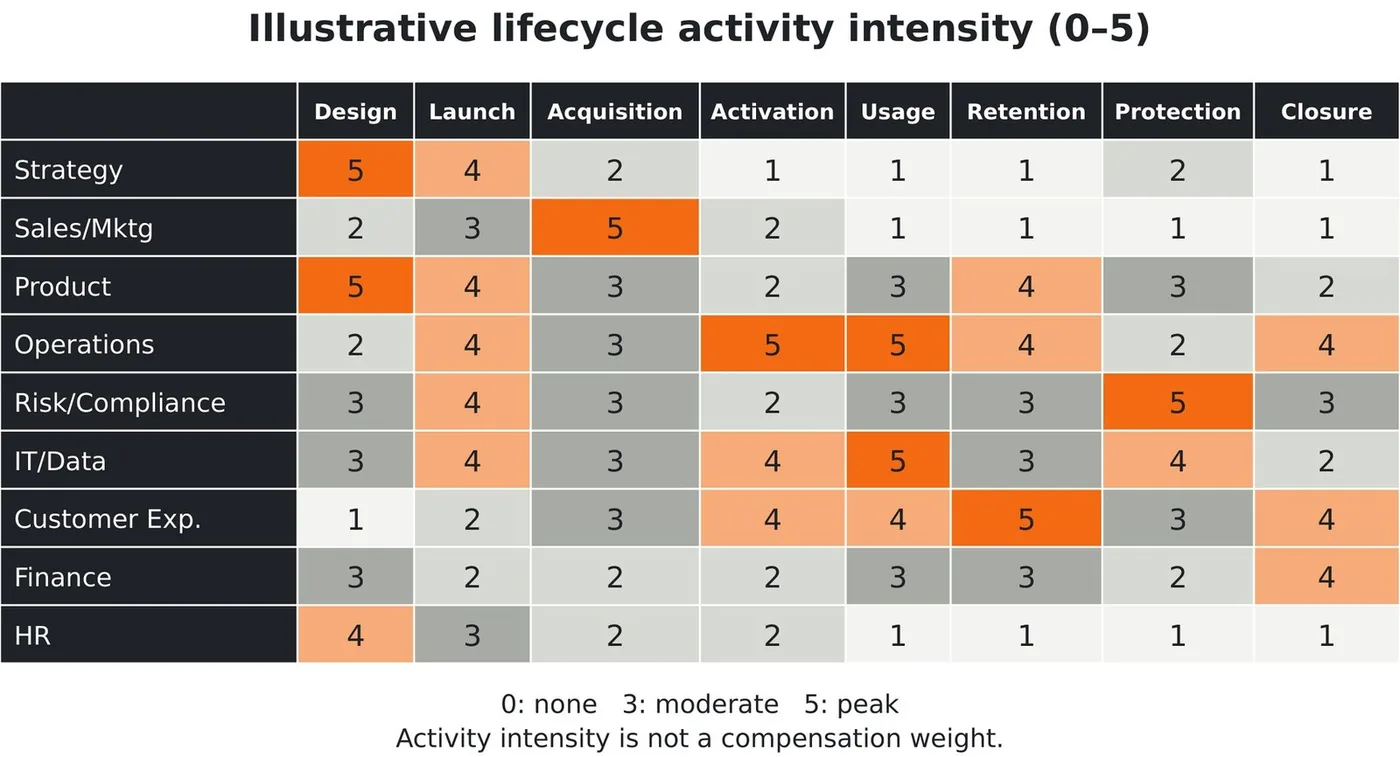
Four ways a function can matter
| Type | Definition | Double-counting guard |
|---|---|---|
| Value Creation | Directly increases risk-adjusted revenue, margin, adoption, retention or productivity | Credit the outcome once, then split it among genuine contributors |
| Value Protection | Prevents or reduces financial, regulatory, customer, quality or reputational harm | Use a conservative counterfactual; don’t count the avoided loss and the control activity separately |
| Criticality & Continuity | Keeps the product legally, operationally or technically viable | Represent continuity as an explicit outcome, not an unrecorded premium |
| Enabling Capacity | Provides platform, data, talent or capability used by others | Credit the service used; don’t award full shared-platform value repeatedly |
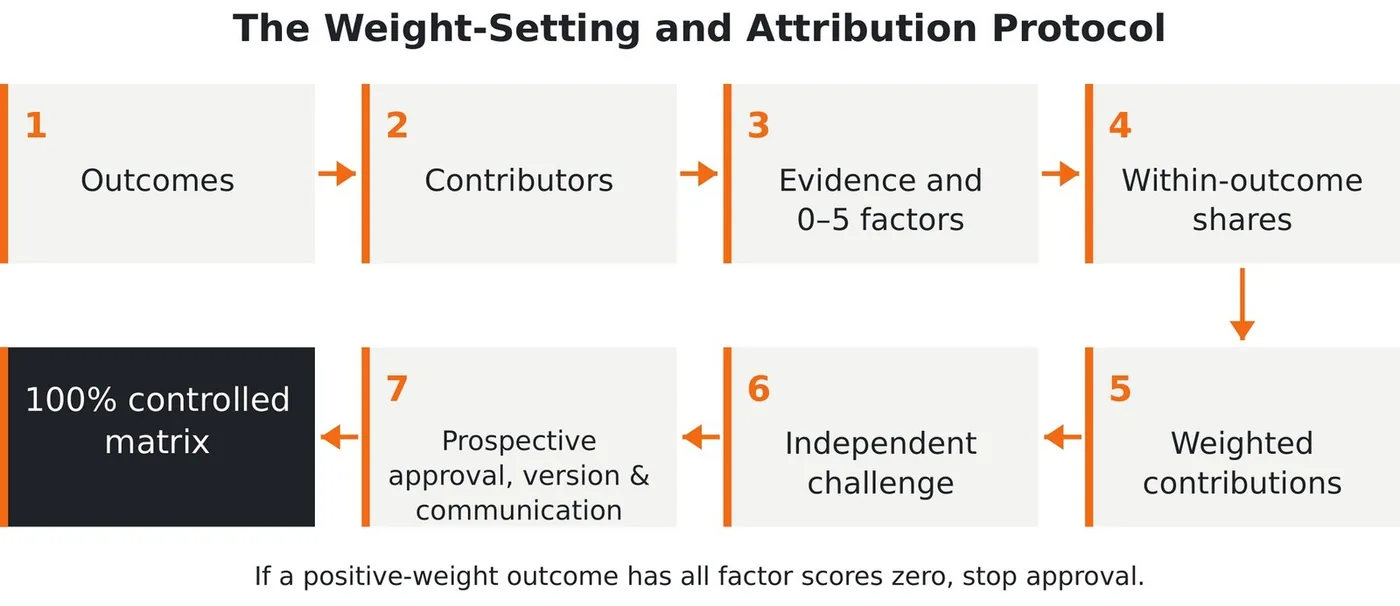
- Define 3–7 product-stage outcomes and give each an importance weight; they total 100%.
- Identify material contributors and classify each claim; confirm reward eligibility separately.
- Score the strength of attribution on four factors, 0–5 each.
- Normalize within each outcome so shares total 100%.
- Combine the outcomes by importance into provisional weights.
- Test, challenge and approve: sensitivity tests, recorded dissent, non-conflicted approval.
- Version and communicate prospectively, before the period.
Weight-setting protocol workbench
Loaded with the book’s complete hypothetical example: three outcomes (Retention 40%, Continuity 35%, Protection 25%) and four eligible functions. Change any I/A/E/K score, outcome importance or coefficient. The book’s result is 28.4% / 24.6% / 23.4% / 23.6%.
Evidence-source and data-confidence standard
| Grade | Definition | Permitted use |
|---|---|---|
| A · Verified | Stable definition, traceable source, reproducible, controls done, named owner | Compensation-ready, subject to the full readiness gate |
| B · Controlled proxy | Stable proxy or model with documented limits and owner | Shadow pilot; live use only if non-material or independently validated |
| C · Judgement | Expert judgement, manual estimate or untraceable source | Simulation only; never the sole basis for a material real-pay decision |
Prospective weights and exceptional changes
Weights, score ranges, Health Gates and eligibility that affect pay are approved and communicated before the period. Ordinary recalibration takes effect next period. A mid-cycle change is reserved for a defined exceptional event (a material regulatory requirement, an acquisition, a product closure, a major crisis) and needs a written trigger, a non-conflicted quorum, a new version and a prospective effective date. It is never used retroactively to reduce earned pay.
Common weighting errors
| Error | Why it distorts | Control |
|---|---|---|
| Recency bias | The latest event dominates | Start from forward-looking outcomes |
| Round-number inertia | Comfortable numbers survive without evidence | Annual clean-sheet reset and sensitivity tests |
| Double counting | Several departments claim the full shared outcome | Normalize shares within every outcome to 100% |
| Workload substitution | Effort is treated as value | Use workload only as one factor |
| Political adjustment | Influence overrides evidence | Tolerance, written reasons, independent review |
✔ Key takeaways
- The metaphor explains roles; the matrix records evidence and prospective policy weights.
- Contribution is classified before it is weighted, and shared outcomes are normalized.
- Every material weight carries evidence, an owner, a data-confidence grade, a version and an effective date.
- Pay-affecting weights are prospective; exceptional changes are rare, governed and versioned.
? Questions for reflection
- Which three to seven outcomes best describe the product-stage you are trying to reward?
- Which claim in your current reward debate is workload rather than demonstrated value?
- Could an independent team reproduce your weights from the same evidence?
Part III · Chapter Eight
From Contribution to Reward Formula
Turning the analogy into arithmetic: a single, explainable formula and the safeguards that keep it honest.
A model without a formula may remain an inspiring analogy. A model with a formula can be tested, audited and explained. The recommended formula is deliberately simple, so any employee can follow it.
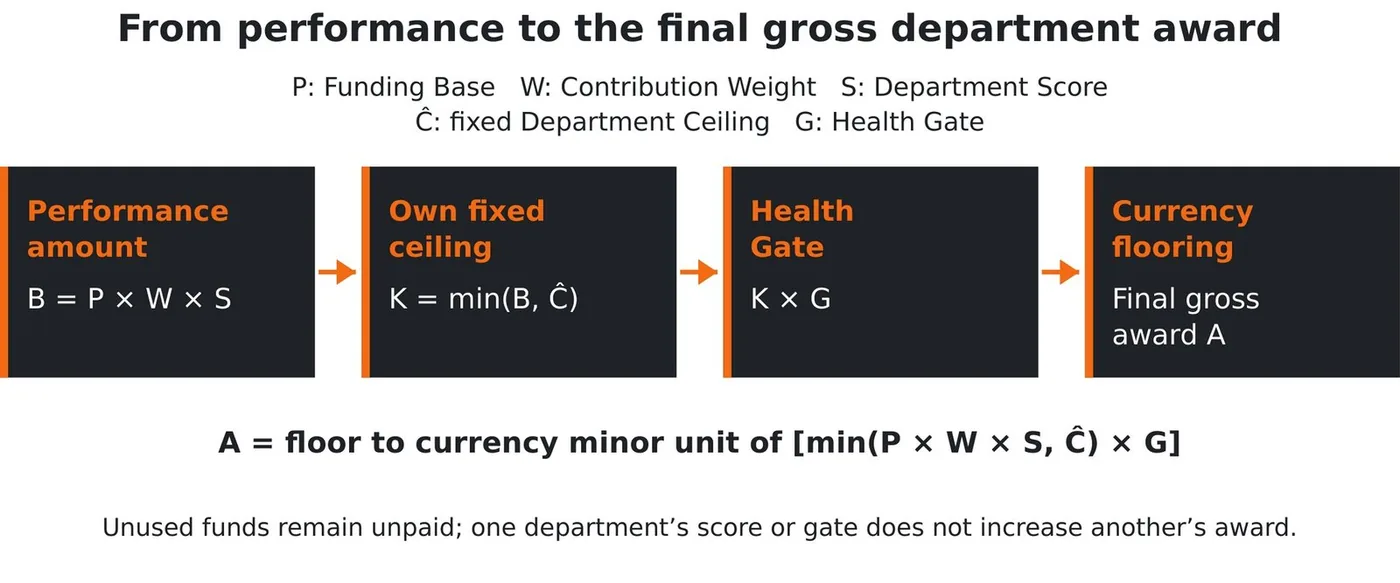
Two pool numbers, not one
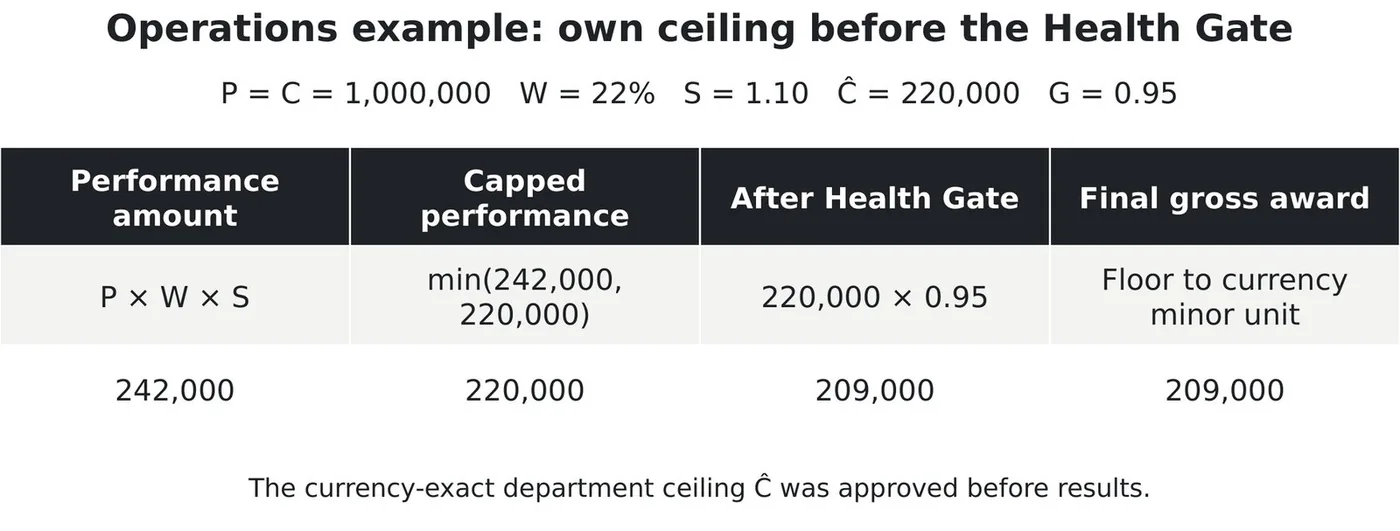
P is the funding base used to price target performance. C is the funded maximum, including any pre-approved stretch reserve (C ≥ P; with no stretch, C = P). Both are fixed before the period from a disclosed forecast, budget or prior-period basis. Each department receives a fixed share of C, its ceiling Ĉ, before performance is observed. No department ever receives another department’s withheld amount.
The TCB™ reward calculator
Performance scores: ordinary performance lives here
Each KPI is converted to an achievement factor on a curve approved before the period: zero anchor, target anchor (= 1.00), stretch anchor and cap, interpolated linearly. The department score is the weighted sum. People should be evaluated mainly on outcomes they can influence: the controllability principle (Giraud et al., 2008).
Health Gates that can actually bite
| Category | Clean 1.00 | Minor ~0.90 | Serious ~0.70 | Breach → 0 |
|---|---|---|---|---|
| Risk | No exceptions | Isolated, contained | Repeated or material | Major control failure |
| Quality | Within tolerance | Minor defect rise | Sustained decline | Customer-impacting failure |
| Customer | Stable / improving | Small complaint rise | Rising detriment | Mis-selling or harm |
| Compliance | Fully compliant | Documentation gaps | Repeated findings | Regulatory action |
| People | Healthy | Elevated attrition | Burnout signals | Safety / conduct event |
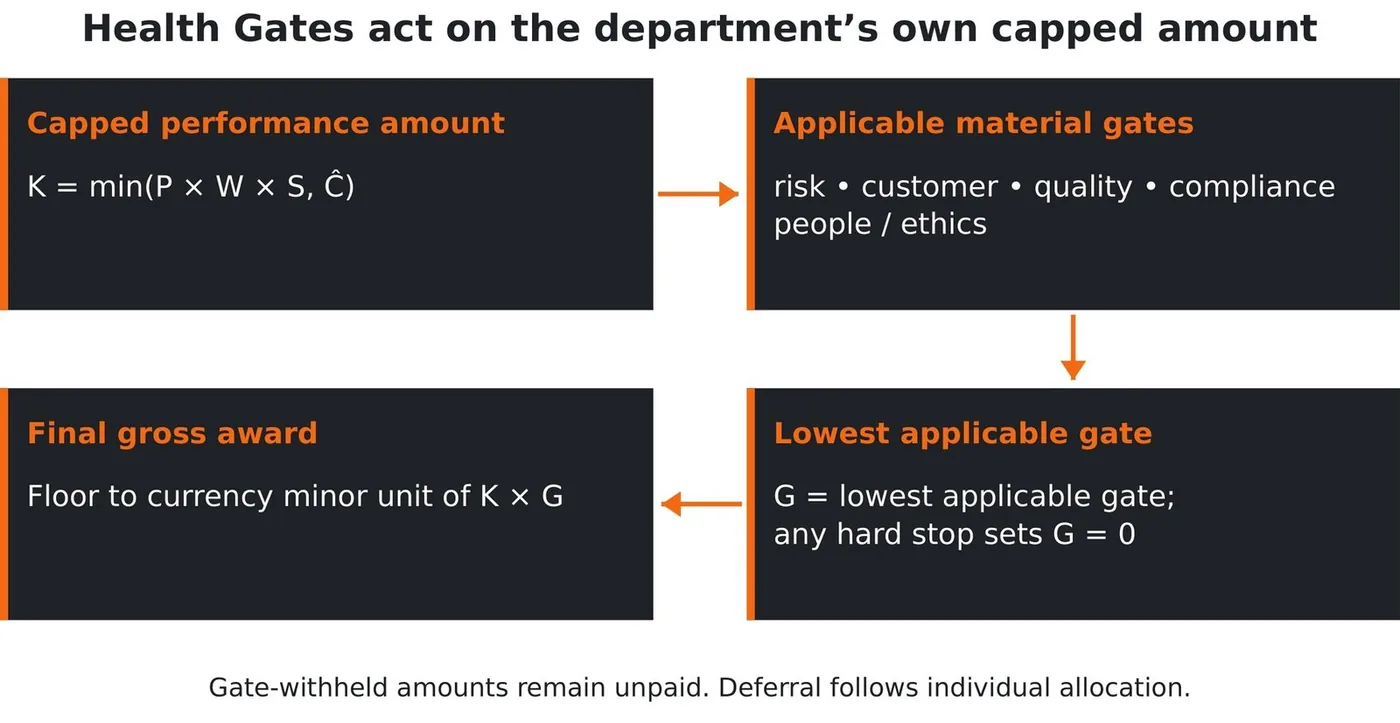
Use the lowest applicable material multiplier; any hard stop sets the gate to zero. Weak performance belongs in the score. A Health Gate is for harm, not mediocrity, and a gate that can never bite is decoration, not a safeguard. Build one in Chapter 12.
Individual distribution: normalize to the department pool
Share a department award among employees
Loaded with the book’s Operations pool of 209,000 and employees A–D. Quotas are floored to the cent, and leftover cents go by largest remainder, so the total always reconciles exactly.
Deferral and later adjustments
Allocate each employee’s gross award first, then apply the pre-approved deferral schedule: deferred percentage, release date, vesting tests, malus, recovery and leaver rules. For example, a 20% deferral on Employee A’s 77,932.20 gives 62,345.76 cash now and 15,586.44 deferred. Malus, clawback and leaver treatment are jurisdiction-specific and require legal, HR, payroll and regulatory review.
Research supports neither pure equality nor a forced curve as a universal answer: team rewards performed better when distributed equitably rather than simply equally (Garbers & Konradt, 2014).
✔ Key takeaways
- Performance is capped at each fixed department ceiling before its own Health Gate and downward rounding.
- The funding base and maximum ceiling are set before results are known.
- Unused capacity, underperformance, gate deductions and rounding residuals remain unpaid; none transfer to another department.
- Allocate within each department-product pool and reconcile exactly; then sum each employee’s awards across products.
- Deferral and later adjustments are prospective rules subject to local law and professional review.
? Questions for reflection
- Is your current pool a funding target, a hard ceiling, or an ambiguous mixture of both?
- Could an independent person reproduce the final department and individual awards exactly?
- Which long-term outcomes justify deferral, and are the vesting and leaver rules known before the cycle?
Part IV · Chapter Nine
Templates and Practical Tools
Seven working templates that move the model from theory to a Monday-morning starting point.
A model becomes useful only when people can apply it. These templates are starting points, not rigid forms. Each tool that can influence pay must be controlled, versioned, attributable, and able to recreate the decision after the people involved have changed roles.
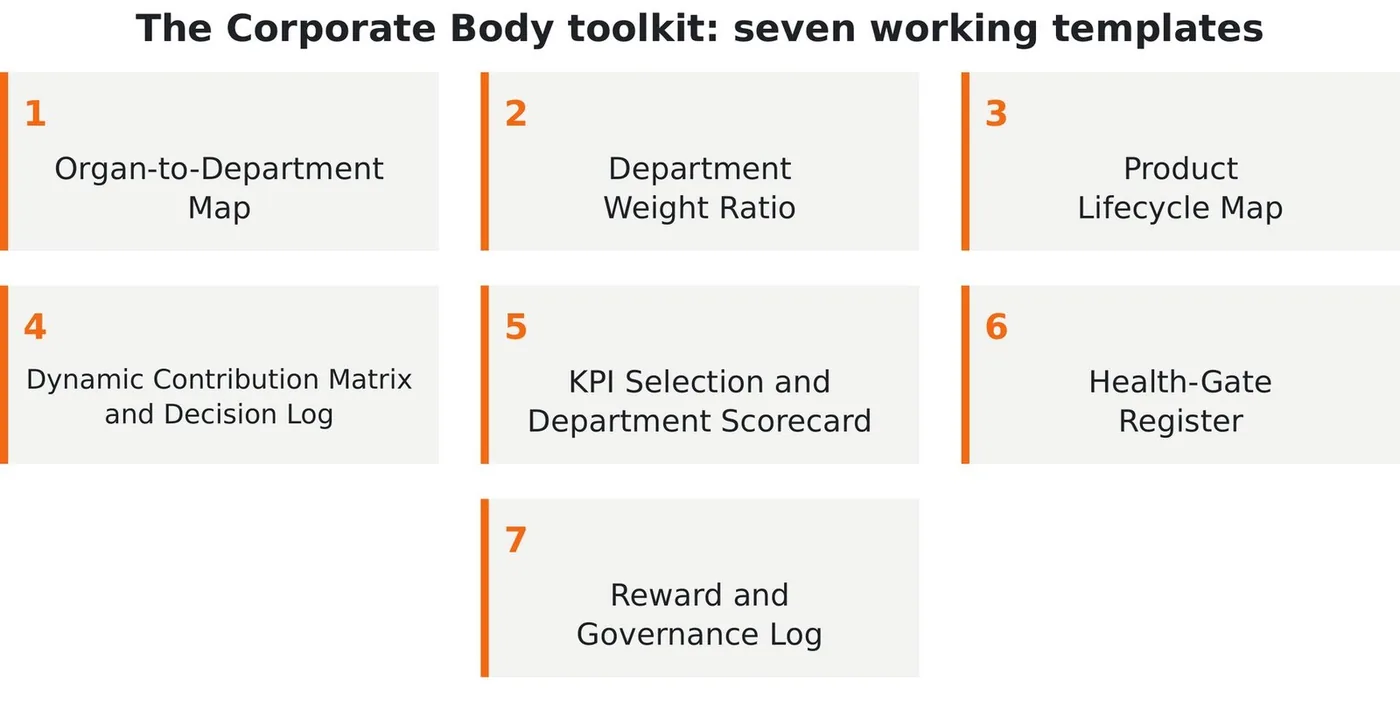
| Tool | What it records | Work with it here |
|---|---|---|
| 1 · Organ-to-Department Map | Communication role and evidence-based contribution claim per function | Organ map explorer |
| 2 · Department Weight Ratio | Structural size; tests density and people health, never an allocation rule | Value density calculator |
| 3 · Product Lifecycle Map | Stage, outcome, owner, transition trigger, dominant functions, review date | Lifecycle explorer |
| 4 · Contribution Matrix & Decision Log | Outcome, type, attribution role, evidence, grade, range, approved point, version | Weight-setting workbench |
| 5 · KPI Selection & Scorecard | Metric weight, target, actual, index, influence, data owner and grade | Appendix G scorecard |
| 6 · Health-Gate Register | Clean / minor / serious / breach thresholds, evidence and multiplier | Health Gate builder |
| 7 · Reward & Governance Log | P, C, W, Ĉ, S, B, K, G, final award, employee total, unpaid amount, approvals | Reward calculator |
Tool 7 — Reward and governance log (book illustration)
| Field | Rule | Illustration |
|---|---|---|
| Funding base P | Fixed before period | 1,000,000 |
| Maximum ceiling C | Prefunded; C ≥ P | 1,000,000 |
| Prospective weight W | Approved matrix | 22% |
| Fixed department ceiling Ĉ | Prospective allocation of C × W | 220,000 |
| Performance score S | Controlled scorecard | 1.10 |
| Performance amount B | P × W × S | 242,000 |
| Capped performance K | min(B, Ĉ) | 220,000 |
| Health Gate G | Lowest material gate; hard stop 0 | 0.95 |
| Final gross department award | floor currency(K × G) | 209,000.00 |
| Unused capacity and deductions | Remain unpaid | 11,000.00 |
Three stages of tooling maturity
| Stage | What it looks like | Main control risk |
|---|---|---|
| Spreadsheet | One controlled workbook for one pilot product | Version drift, silent formula errors |
| Shared controlled model | Single source, access control, versioning, approval workflow | Manual discipline and reconciliation |
| System | Stored inputs, calculations, evidence, approvals and audit trail | Opacity if the logic is hidden from users |
The destination is not sophistication. It is consistency, transparency, exact reconciliation and memory: one calculation everyone understands and a record of every change.
Common toolkit mistakes
- Precision theatre: decimal weights imply more certainty than the evidence supports. Use ranges, grades and sensitivity tests.
- Accelerator before brakes: the matrix allocates reward before gates and safeguards are ready. Define gates, data rules and governance first.
- Local copies of the truth: different spreadsheets produce different results. Use one controlled source.
- Opaque automation: a system calculates but nobody can explain the result. Preserve the public logic and the audit trail.
✔ Key takeaways
- Tools that influence pay are controlled documents with owners, versions, effective dates and audit trails.
- The toolkit includes exact pool reconciliation and normalized individual allocation.
- Data confidence and controllability are visible in the matrix and scorecard.
- A simple, transparent, controlled model is better than an elaborate opaque system.
? Questions for reflection
- Could your current spreadsheet reproduce the exact reward decision six months later?
- Which data fields in your pilot are Grade C and therefore unsuitable as sole live-pay drivers?
- Who owns each tool, version and approval?
Part IV · Chapter Ten
Case Study: Credit Cards in a Bank
A three-year walk-through showing contribution shifting from sales to service, and why operations is the heart.
A card must be approved, issued, activated, used, serviced, protected, retained and sometimes closed. If the bank rewards only sales for the new card, it ignores the departments that make the card profitable over time. If it rewards only retention, it ignores the effort needed to acquire customers. TCB™ rewards both stages differently. The numbers are hypothetical and show a policy, not observed causal allocations.
Watch the weights move across three years
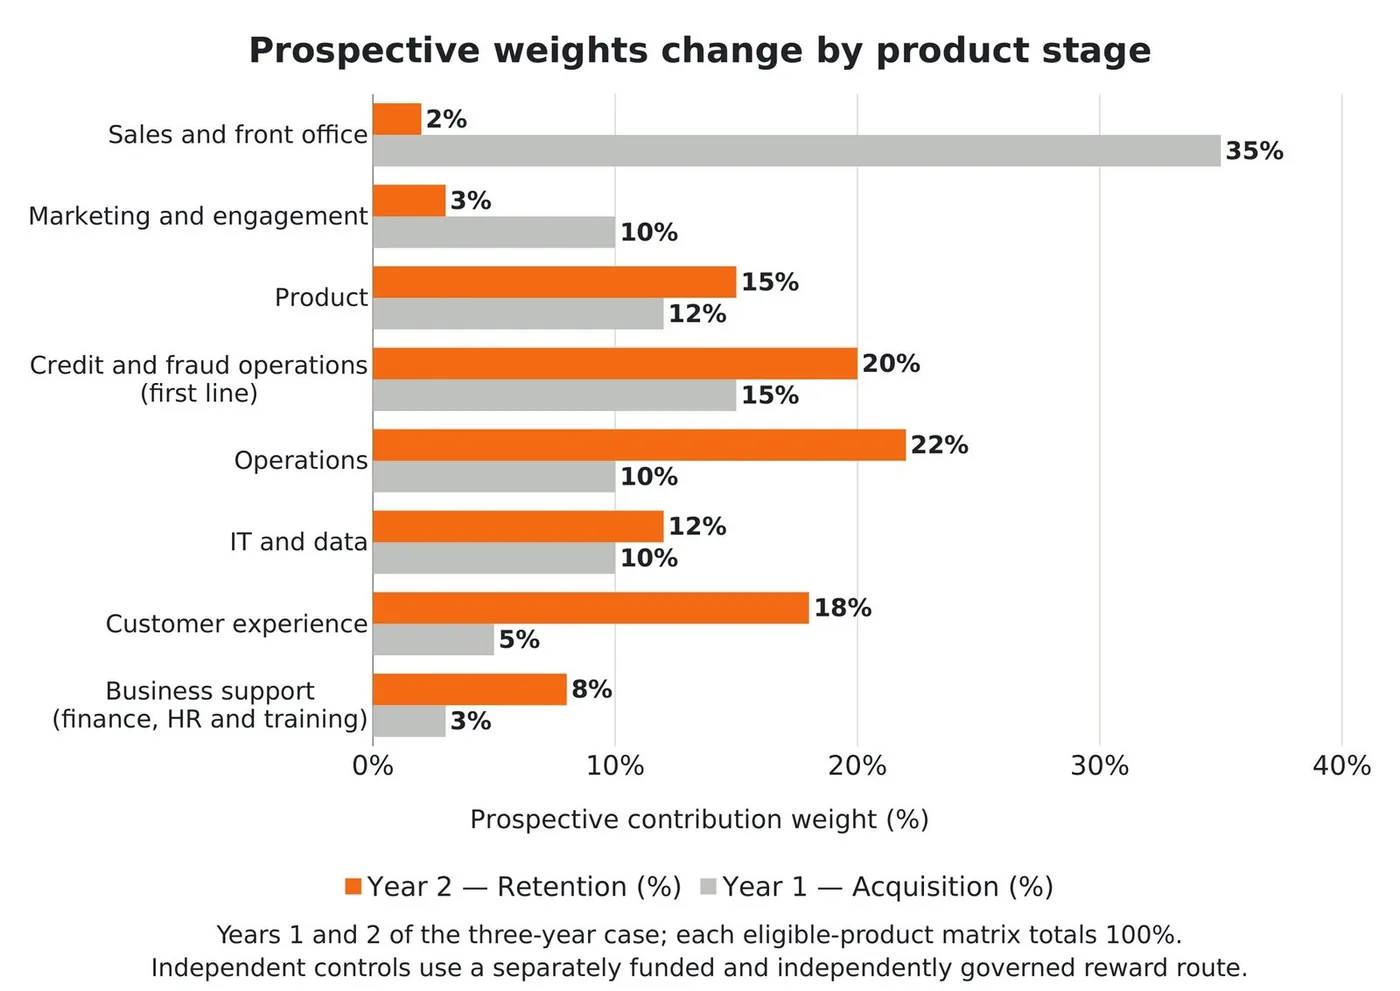
Grey ghost bar = the previous year’s weight. Every column totals 100% among eligible business functions.
Year 1 · Acquisition and activation
Sales gets the largest weight (35%) because of its assumed role in attracting suitable, active customers, not because the body is “running”. Performance and Health Gates then separate quality from volume: mis-sold, fraudulent, unsuitable, inactive or unprofitable cards receive the published treatment.
Year 2 · Retention, usage and protection
Operations supports service continuity, transactions, billing and disputes; customer experience addresses problems that affect loyalty; the product owner reviews features, pricing and usage. Sales remains eligible with a smaller role (2%).
The role of Operations
Dispute delays, billing errors, failed transactions and slow service damage the relationship. Calling Operations the heart makes that role memorable; it does not establish a percentage.
Operations: a three-year reward trajectory
| Year | Stage | W | S | Ceiling | G | Final award |
|---|---|---|---|---|---|---|
| Year 1 | Acquisition | 10% | 1.00 | 100,000 | 1.00 | 100,000 |
| Year 2 | Retention | 22% | 1.10 | 220,000 | 0.95 | 209,000 |
| Year 3 | Defence & protection | 22% | 1.05 | 220,000 | 1.00 | 220,000 |
The Year 2 amount is 2.09 times Year 1 because the approved weight rises from 10% to 22% while the gate reduces the capped amount by 5%. Scores above 1 reach the fixed ceiling; they do not create unfunded stretch. The 209,000 is then shared among employees A–D exactly as in Chapter 8: 77,932.20 · 61,991.53 · 42,508.47 · 26,567.80.
What a live pilot must add
- Outcome and department weights approved before the performance period.
- Acquisition and retention measures with stable definitions and traceable sources.
- Quality, suitability, fraud, complaints, credit performance and customer harm able to reduce or defer reward.
- Every ceiling and award verified, with the product ledger reconciled to the approved ceiling.
- Individual allocations that add exactly to the department award and pass legal, payroll and pay-equity review.
✔ Key takeaways
- Expected business contributions change across acquisition, retention and protection; independent oversight remains necessary throughout.
- The retention Operations calculation gives 209,000 under a fixed 220,000 ceiling and a 0.95 gate.
- The case illustrates the mechanism; it does not establish effectiveness.
- The individual layer differentiates from evidence and normalizes exactly to the department amount.
? Questions for reflection
- Which product-stage weights in your organisation are still frozen in their launch pattern?
- Which after-sale functions create or protect value that the current reward system cannot see?
- Can you reconcile the product pool and the individual payouts exactly?
Part IV · Chapter Eleven
Additional Industry Examples
The same logic, re-weighted: software, manufacturing, healthcare, retail, logistics and utilities each activate different organs.
TCB™ was developed through a banking lens but is intended to be adaptable. These hypothetical examples demonstrate the method; they are not final prescriptions.
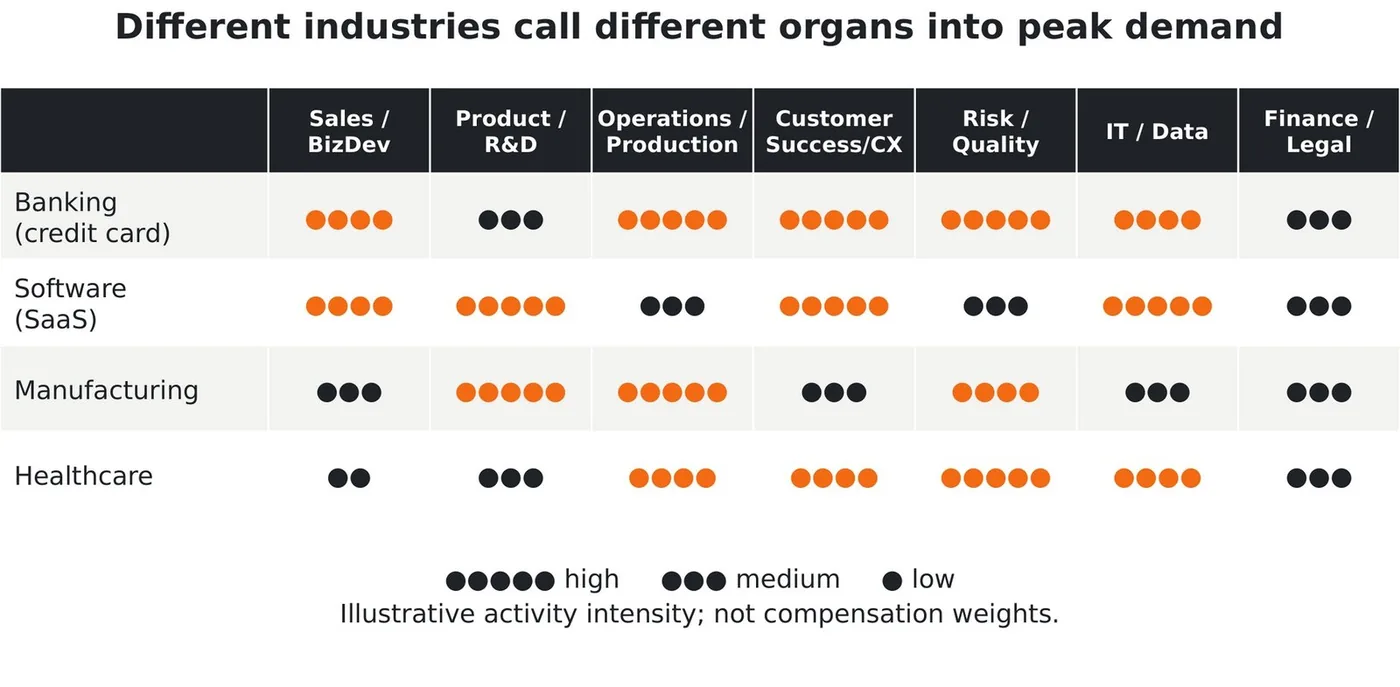
Indicative weights by industry and stage
Manufacturing
Sales and engineering carry weight while the product is specified and sold; manufacturing, supply chain and quality dominate during production; after-sales service, warranty and spare parts lead after delivery. A fixed annual department reward would miss these shifts.
Healthcare
Patient safety, ethics and clinical quality are non-negotiable. Reward must never push unsafe volume, and gates must include patient outcomes, safety incidents, compliance and professional ethics.
Energy and utilities
The dominant activity is stewardship: keeping critical infrastructure safe and within regulatory limits. Operations, asset management and safety carry the largest share, with engineering rising during major projects. Weighting stewardship explicitly stops a reward system from quietly favouring visible new projects over keeping existing assets safe.
Does the model fit a new industry?
Ask first whether the work changes meaningfully across products or stages, and whether differentiated contributions can be described credibly. Then ask which harms the incentive must never reward. The model may add little where roles are stable and a simpler policy already works, and it may be unsuitable for live pay where attribution is too uncertain or independence cannot be protected.
A checklist for adapting the model
- Identify the product or service and its lifecycle stage.
- List the activities that create and sustain its value now.
- Map those activities to organs.
- Set weights from evidence; each column totals 100%.
- Define Health Gates for the harms this industry must never reward.
- Choose score inputs the functions genuinely control.
- Agree the recalibration cadence and stage-change signals.
- Run a pilot, baseline the measures and review honestly before scaling.
✔ Key takeaways
- The method is a proposal for adaptation and testing; suitability depends on context, evidence and safeguards.
- Software, manufacturing, healthcare and banking all activate different organs at different moments.
- The model is adaptable because it starts with function and evidence, not a fixed template.
? Questions for reflection
- In your industry, which organ is most under-recognised by current reward practice?
- Where would a volume-based incentive be actively dangerous, and how would a Health Gate guard it?
- What would the acquisition-versus-retention split look like for your flagship product?
Part V · Chapter Twelve
Risks, Safeguards, and Governance
Every incentive can be gamed. This chapter attacks the model on purpose and arms it against its own failure modes.
| Risk | Safeguard |
|---|---|
| 1 · Departments cut too many people to raise reward per person | People-health gates: workload, overtime, errors, attrition, sick leave, quality. Reward falls if efficiency damages the organ. |
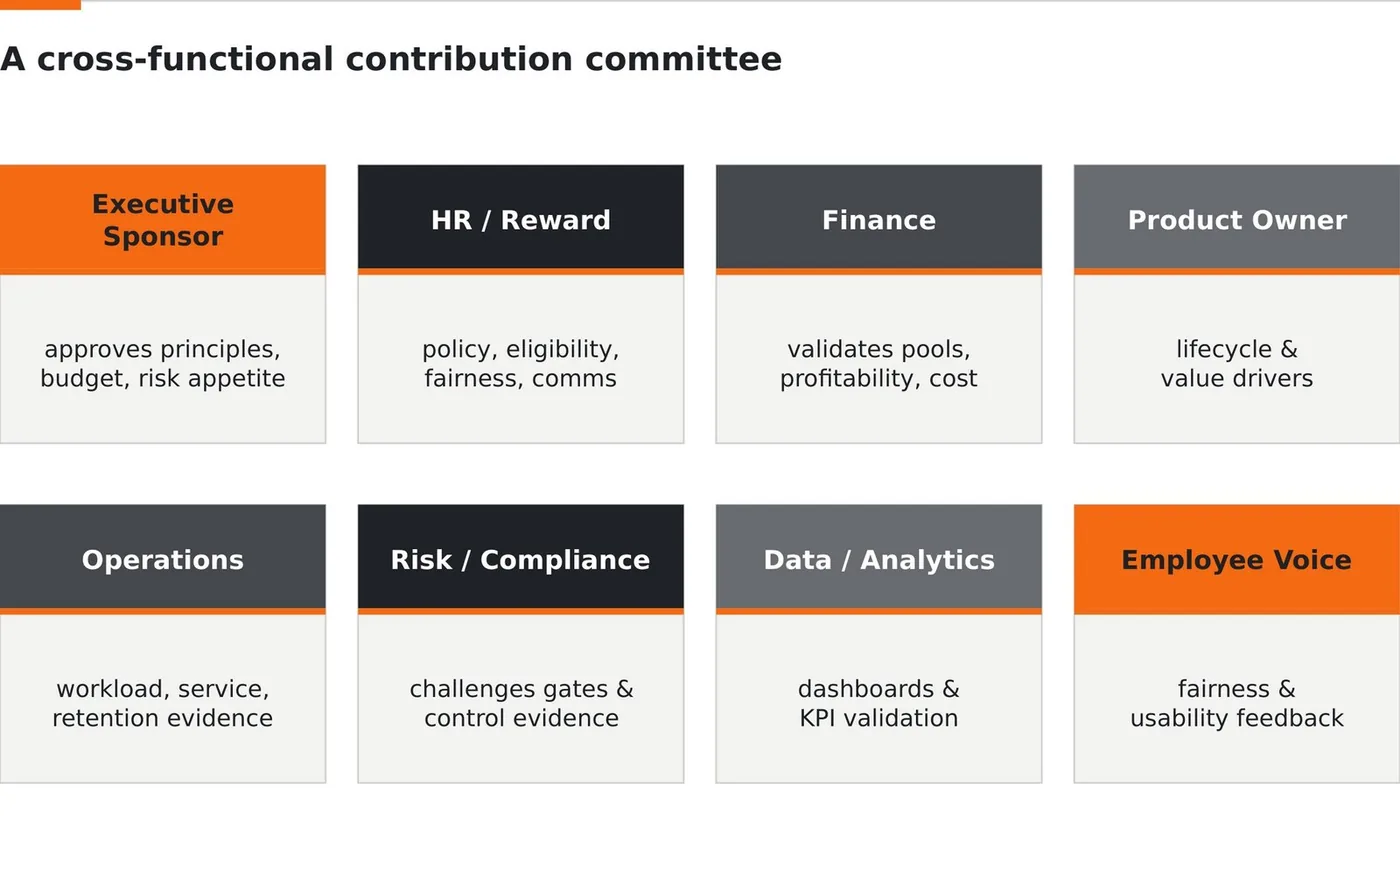
| 2 · Departments fight over percentages | A cross-functional committee with evidence, non-conflicted quorum and written reasons; weights approved prospectively. |
| 3 · Sales brings bad customers | Quality-adjusted acquisition: activation, early attrition, complaints, default, fraud, suitability, profitability, plus deferral. |
| 4 · Control functions become blockers | Separate first-line execution from independent oversight; control pay is set by an independent authority, never the monitored business. |
| 5 · Metrics are manipulated | Audit checks, data validation, triangulated metrics and Health Gates; no single-metric rewards. |
| 6 · Long-term value is ignored | Defer part of reward against retention, complaints, fraud losses, profitability and lifetime value. |
| 7 · The model becomes too complex | Explain one sequence: performance → fixed ceiling → Health Gate → round down. Every step that affects pay is visible. |
Health-Gate register
Set the evidence for each category. The overall gate G is the lowest material multiplier; any breach is a hard stop. The example applies it to Operations’ capped 220,000.
Conflicts of interest
- Disclosure of departmental, personal and evidence-ownership interests before each material decision.
- Present, don’t decide: a conflicted member may give evidence but cannot vote or count toward quorum.
- Non-conflicted quorum with an independent chair and unaffected HR/Reward, Finance and Risk/Compliance expertise.
- Substitutes are pre-authorised. Recusal is never waived to complete a quorum.
- Independent fallback: if no valid quorum is possible, no decision is taken.
Overrides and appeals
An appeal names the specific factor alleged to be wrong (weight, score, gate, data item, reconciliation or allocation) within a published window. A correction applies to everyone affected, not only the appellant. A successful appeal corrects the model; an unsuccessful one explains the decision.
Calibration cycle
| Cadence | Decision |
|---|---|
| Before the period | Outcomes, eligible functions, weights, score curves, gates, funding, ceilings, rules, effective dates |
| During the period | Monitor evidence and harm; changes stay prospective except the exceptional process |
| At the reward cycle | Reproduce every amount, cap, gate and rounding; reconcile allocations, deferral and appeals |
| Annually | Review matrices, calibration, pay-equity findings, overrides, appeals and burden |
Incentive systems often generate the behaviour they pay for rather than the behaviour leaders say they want (Kerr, 1975), and strong rewards on measurable tasks pull effort from harder-to-measure work (Holmstrom & Milgrom, 1991). Balanced scores and gates reduce this risk; no design eliminates it.
A decision that cannot be reconstructed cannot be defended.
✔ Key takeaways
- Committee membership creates potential conflicts that must be disclosed and managed.
- Appeals and overrides identify specific evidence or calculation issues; they are not informal renegotiations.
- Pay rules are prospective, versioned and reviewed on a predictable calendar.
- Governance records are part of procedural fairness and model validation.
? Questions for reflection
- Who on your proposed committee would be conflicted when their own department is weighted?
- Can an appeal identify and correct a specific factor without reopening the entire cycle?
- Which governance record would be missing if an auditor tried to reconstruct last year’s decision?
Part V · Chapter Thirteen
Implementation Roadmap
Not a company-wide switch, but a staged experiment: one product, one cycle, measured and improved.
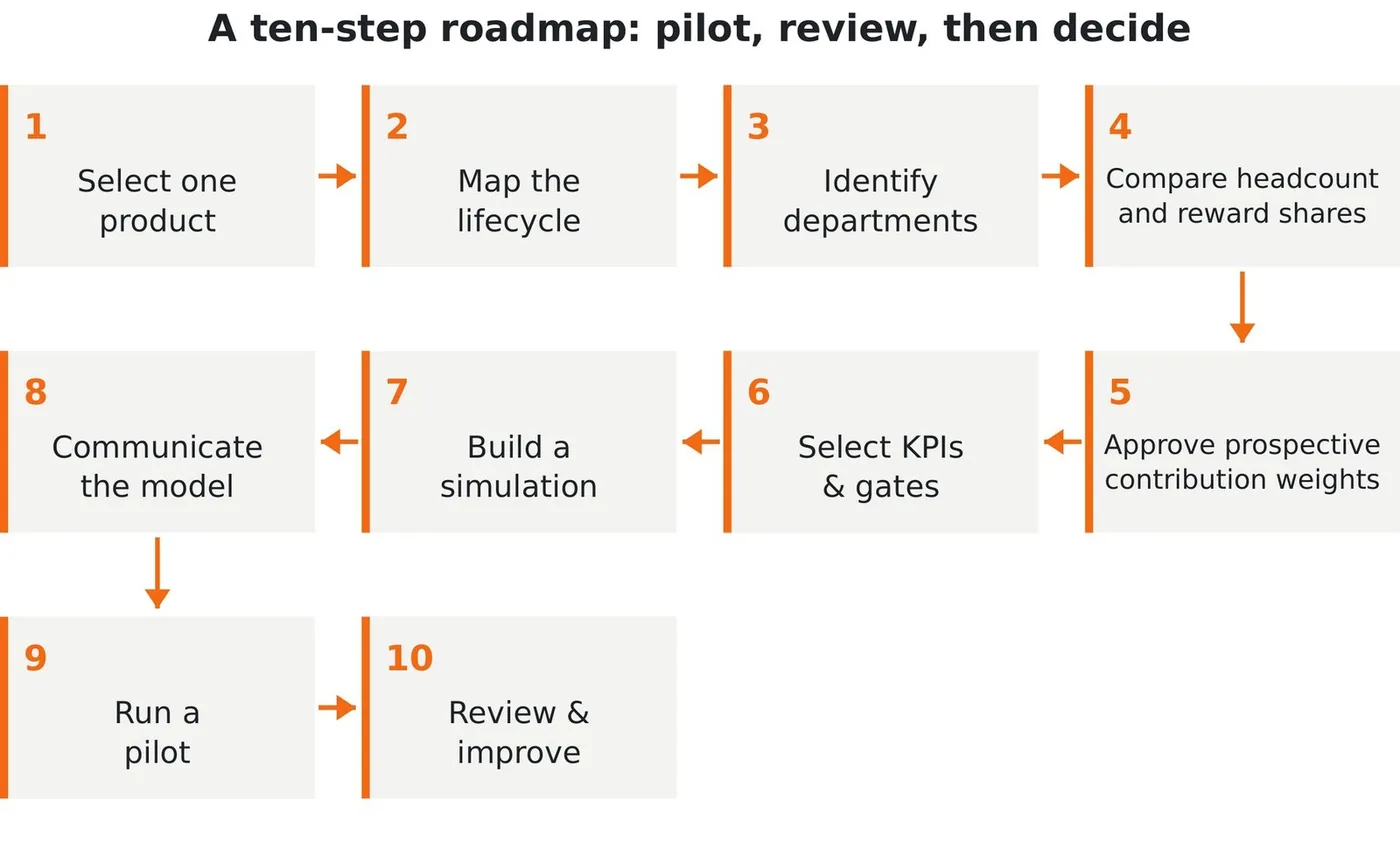
- Select one product with clear value, clear stages and several departments involved.
- Map the product lifecycle: design, launch, acquisition, activation, service, retention, protection, renewal, closure.
- Identify departments and organ roles so hidden contributors are not ignored.
- Compare headcount and reward shares as diagnostics only.
- Assign weights using the outcome protocol, evidence grades, normalization and conflict rules.
- Select controllable KPIs and Health Gates that can reduce or block reward.
- Build a historical simulation and sensitivity analysis; reproduce it independently.
- Communicate the metaphor, method, pool rules, data, appeals and no-go conditions before any pay impact.
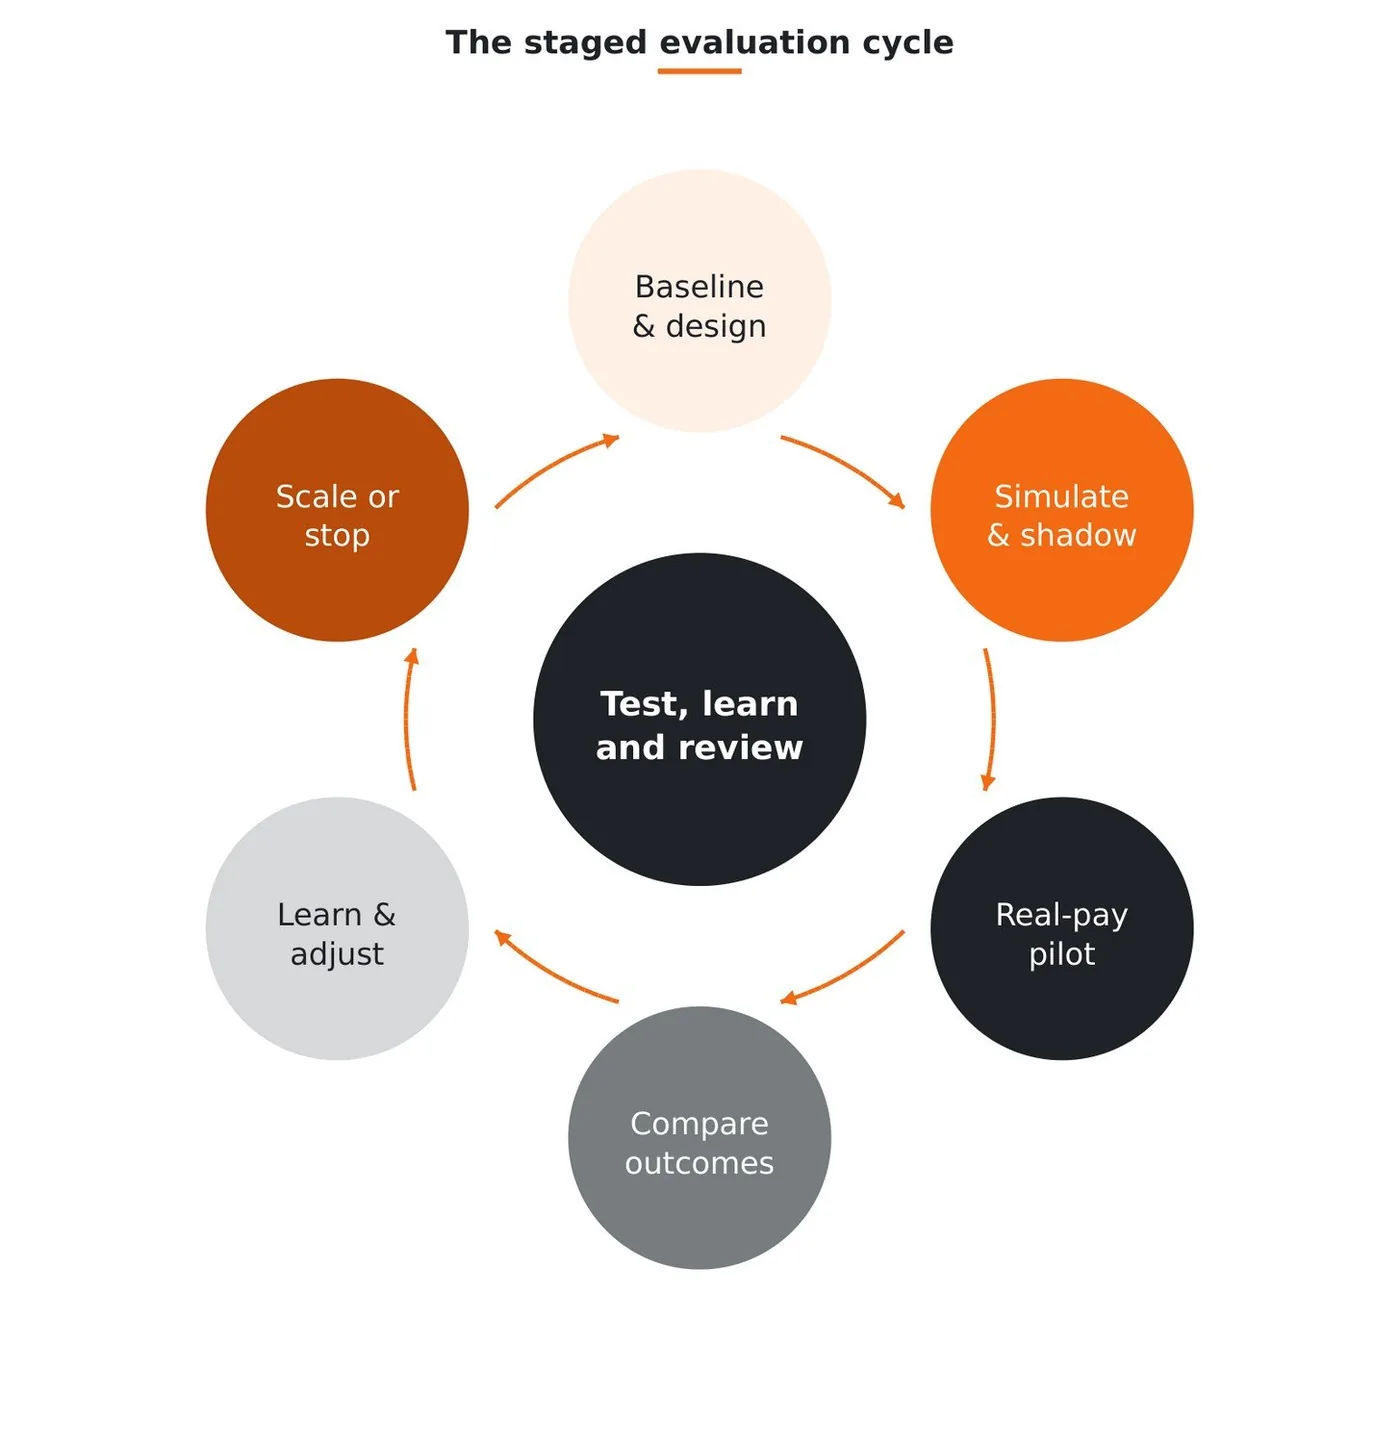
- Run a shadow period without changing pay; only after the readiness gate may a real-pay pilot start.
- Review honestly: stop, redesign, extend shadow, authorise a scoped pilot, or scale.
Three data-readiness stages
| Stage | Pay impact | Minimum conditions |
|---|---|---|
| 1 · Conceptual / simulation | None | Assumptions and Grade C judgement permitted; gaps explicit; scenarios stress-tested |
| 2 · Shadow / parallel pilot | No direct effect | Stable KPIs, named owners, traceable sources, controlled calculation, versioning, reconciliation, feedback |
| 3 · Compensation-ready | Affects real pay | Grade A drivers or accepted Grade B proxies, lineage, audit trail, exact reconciliation, professional sign-offs |
Compensation Readiness Gate
Tick each sign-off and condition that has fully passed. “Conditional” or “not reviewed” counts as not passed.
Fairness includes access to opportunity
Employees with identical individual performance may receive different awards because they work in different products or stages. Before live pay, simulate those differences by job family, grade, location and relevant groups; examine who can reach high-weight work and who is persistently excluded. An unresolved material fairness issue is a no-go.
A first-year rollout timeline
| Quarter | Focus | Key milestones |
|---|---|---|
| Q1 | Frame and align | Sponsor named; committee and conflict rules set; pilot chosen; outcomes, gates and readiness owners defined |
| Q2 | Build and calibrate | Protocol run; matrix and scorecards versioned; simulation, sensitivity and independent reproduction |
| Q3 | Shadow pilot | Run in parallel; no pay impact; feedback, data exceptions and appeals reviewed |
| Q4 | Decide and plan | Validation report; readiness gate; stop, repeat, extend shadow, or authorise a scoped pilot |
Common objections and constructive answers
| Objection | Constructive response |
|---|---|
| “This is a way to cut pay.” | Show the funding base, ceiling, unpaid-amount rule and product economics. |
| “It will be used against my team.” | Publish outcomes, evidence, weights, conflicts, written reasons and appeal rights. |
| “It is too complicated.” | Lead with the metaphor, then show one end-to-end calculation. |
| “Our work cannot be measured.” | Use the taxonomy, controlled proxies, confidence grades and sensitivity tests. |
| “We tried reward reform before.” | Use a shadow pilot, explicit no-go criteria and an honest stop option. |
✔ Key takeaways
- Simulation, shadow testing and compensation-ready use are different stages with different evidence standards.
- A real-pay pilot is gated by exact reconciliation, reproducible data, managed conflicts and professional sign-offs.
- Rules are communicated before the period, and ordinary changes take effect prospectively.
- The organisation must retain an honest decision to stop, redesign, repeat or scale.
? Questions for reflection
- Which readiness stage is your organisation genuinely in today?
- Which sign-off would currently block a real-pay pilot?
- What evidence would cause leadership to stop rather than scale the model?
Part V · Chapter Fourteen
Study Design and Validation Proposal
A model presented as an experiment deserves to be tested like one, with hypotheses, measures and honest limitations.
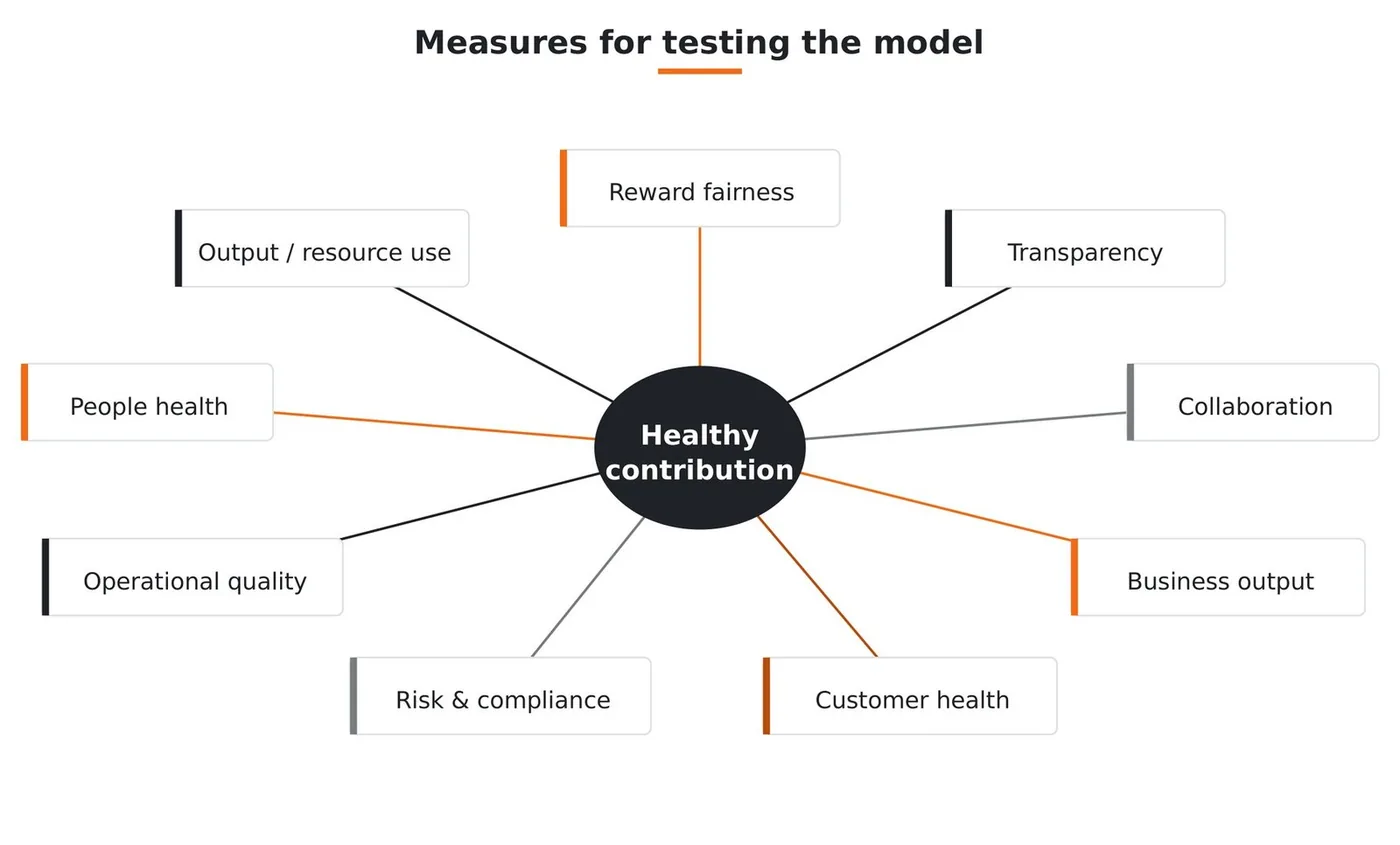
Research question: does the complete TCB™ policy package improve perceived fairness, transparency and business alignment compared with the organisation’s existing approach, and does independently measured performance improve without material deterioration in customer, risk, quality, safety or people outcomes?
Six hypotheses
| H1 | Employees in the pilot report higher reward transparency. |
| H2 | Employees in the pilot report higher perceived fairness. |
| H3 | Cross-functional collaboration improves when departments understand how product-stage contribution affects reward. |
| H4 | Lifecycle KPIs (activation, retention, error reduction, complaint resolution) improve or remain stable. |
| H5 | Risk, compliance, customer, quality and employee-health indicators do not materially deteriorate. |
| H6 | Independently measured risk-adjusted output per comparable resource improves without material harm. |
Three evaluation stages
Simulation tests arithmetic, assumptions and sensitivities. Shadow testing keeps existing pay and tests data, administration, understanding and reactions to projected awards. An authorised real-pay pilot can examine behaviour under changed incentives. Evidence from one stage cannot substitute for the next.
Illustrative success criteria
- At least 70% of pilot employees understand the reward logic.
- Perceived fairness improves against the baseline survey.
- No material deterioration in risk, compliance, customer, quality or people-health gates.
- Lifecycle KPIs improve or remain stable while transparency improves.
- Managers report reward conversations are easier to explain.
- The committee can explain and defend the weights using evidence.
Threats to validity
Something other than TCB™ may explain an observed change: the market, staffing, leadership or another initiative. A shadow run leaves pay unchanged, so it cannot by itself show the behavioural effect of changed incentives. Repeatedly asking about fairness can change the answers. And the subtlest threat is tuning gates and weights until the numbers look good rather than until the body is healthy.
What would disprove the model?
No improvement in understanding or fairness despite adequate exposure; no useful change in collaboration or independent performance; unacceptable opportunity or pay-equity effects; harm the gates missed; irreproducible decisions; or administrative costs exceeding demonstrated benefit.
A study that cannot fail teaches nothing. The point of the design is to give the model a fair chance to be wrong.
✔ Key takeaways
- TCB™ should be treated as a study and improved through evidence.
- Measure fairness, engagement, collaboration, retention, risk, quality and business value together.
- The goal is not to prove the model perfect; it is to learn whether it is healthier than forced distribution.
? Questions for reflection
- What would count as convincing evidence that the model is fairer, to you and to a sceptic?
- Which health indicator would you watch most closely during a pilot?
- What limitation are you most willing to document honestly if the pilot disappoints?
Conclusion
An Invitation to Improve the Experiment
What the model asks of you, and why familiarity is not the same as fairness.
This book began with a simple frustration: many employees and managers experience performance systems as unfair. A team may perform well, yet the curve forces only a few to be recognised. A manager may know the truth of performance but still be required to fit people into a predetermined distribution.
TCB™ proposes a different way to frame the reward question. The body analogy draws attention to differentiated roles, interdependence, changing activity and the health of the whole. The compensation protocol then requires its own evidence and governance: prospective weights for expected contribution, subsequent performance scores, Health Gates and fixed departmental ceilings. Neither anatomy nor department size determines a reward entitlement.
The invitation is simple: test the model, challenge it, improve it, and share what you learn. If the current system is not fair enough, we should not accept it simply because it is familiar. Companies deserve healthier ways to reward work. Employees deserve to understand how their contribution creates value. Managers deserve tools that help them tell the truth rather than force reality into a curve.
“A company is a body. Departments are organs. Products are activities. Rewards are calories. KPIs are vital signs.”
The healthiest companies learn to feed the right organs at the right time, without damaging the body they are trying to strengthen.
Appendices A–M
Quick-Reference Tools and Implementation Rules
For simulation, shadow testing and controlled implementation. Illustrative numbers are not recommendations.
Appendix L · Reward-system health self-assessment
Tick each statement that is true for your organisation today.
A · Quick reference: the revised framework in 12 steps
- Define one product or activity and one measurement period.
- Name its stage and 3–7 outcomes; importance totals 100%.
- Map material functions and classify the contribution type.
- Score I, A, E and K for each department-outcome pair.
- Normalize within outcomes, combine, approve weights totalling 100%.
- Record evidence, owner, grade, version, effective date, approvers, review trigger.
- Fix P, C and currency-exact ceilings before the period; publish score curves, gates and exposure rules.
- Calculate performance amounts, cap at each ceiling, apply the lowest gate, round down.
- Allocate each department-product amount by eligible units and largest remainder; sum across products.
- Apply the pre-approved deferral schedule; record corrections, conflicts and appeals.
- Run simulation, then shadow; real pay only when all readiness gates pass.
- Validate outcomes, harm, fairness, usability and burden; scale, redesign, repeat or stop.
B · Formula summary
Value Density = Attributed Value ÷ Time-Weighted Product FTE
Policy-Weight Density = W ÷ (Dept Product FTE ÷ Total Product FTE)
Calorie Ratio = Final Dept Award ÷ Total Final Awards
Share(d,o) = F(d,o) ÷ Σ F(·,o) W(d) = Σ Importance(o) × Share(d,o)
A = m × floor[ K × G / m ]
C · Pilot survey questions (stable before-and-after core)
- I understand the reward rules that applied to my work during the named period.
- I can explain how those rules affected my reward.
- The reward process treated contributions like mine fairly.
- The measures used for my work were within my reasonable influence.
- I had a fair opportunity to contribute to work recognised by the reward process.
- The reward process supported cooperation across teams.
- The reward process encouraged me to maintain quality and healthy working practices.
- I could raise an evidence-based concern and receive a clear explanation.
Use the same 1–5 scale before and after, with a separate post-exposure TCB module.
D · Methodological glossary
Funding Base (P): non-negative target funding, fixed before the period on a disclosed basis.
Maximum Payable Ceiling (C): funded maximum gross commitment; C ≥ P, including any prefunded stretch.
Currency-exact ceiling (Ĉ): prospective allocation of C in minor units by largest remainder on W; all ceilings total C.
Performance amount (B): P × W × S, before the ceiling and gate.
Capped performance (K): the lesser of B and Ĉ.
Final department award: K × the lowest material gate, rounded down to the minor unit.
Malus: reduction or cancellation of an unvested amount under a published, lawful rule. Clawback: recovery of a paid amount where legally permitted. True-up: documented correction after validated data restatement.
Shadow pilot: no direct pay impact; tests projections, data, administration and understanding.
E · Frequently asked questions
Is the body analogy the measurement method? No. It communicates roles; evidence and the governed protocol set the weights.
Is a finite pool just another bell curve? No. Ceilings constrain funding, not the distribution of ratings. Every department may meet or exceed target.
What happens to reward not earned? It stays unpaid and never moves to another department in that cohort.
Can weights change mid-cycle? Ordinary changes do not. Exceptional changes need an objective trigger, conflict-managed approval, versioning and a prospective date.
Can managers override the model? Only exceptionally, through a written, evidence-based, version-controlled decision reviewed at the annual reset.
Does TCB™ claim to be empirically proven? No. Chapter 14 defines how it should be tested and what would disconfirm it.
F · A 90-day simulation and shadow-pilot checklist
| Period | Required actions | Output |
|---|---|---|
| Days 1–30 · Frame | Sponsor and pilot; stage and outcomes; preliminary P and C; committee, conflicts, evidence and review owners | Approved scope and readiness plan |
| Days 31–60 · Build | Run the protocol; grade data; define KPIs and gates; matrix, scorecard, reward log; simulation and sensitivity | Versioned shadow model |
| Days 61–90 · Shadow | Run in parallel; reproduce independently; compare; collect feedback; assess legal, payroll, privacy, fairness, risk and audit gaps | Decision: redesign, repeat, extend shadow or prepare scoped real-pay gate |
The first 90 days do not create a deadline for live pay.
G · Sample department scorecard and complete reward log
| Metric | Weight | Target | Actual | Index | Weighted |
|---|---|---|---|---|---|
| Availability | 30% | 99.8 | 99.9 | 1.05 | 0.315 |
| Error-rate change | 25% | −10% | −12% | 1.08 | 0.270 |
| Retention improvement | 30% | +2.0pp | +2.5pp | 1.04 | 0.312 |
| Improvement releases | 15% | 4 | 5 | 1.10 | 0.165 |
| Department score | 100% | 1.062 |
With W = 22% and G = min(0.95, 1.00, 0.95) = 0.95, Operations’ performance amount is 233,640, capped at 220,000 and paid 209,000. The complete eight-function ledger pays 983,600 of a 1,000,000 ceiling; the 16,400 balance (11,000 gate, 2,400 IT/data and 3,000 marketing unearned) stays unpaid. Load this ledger in the calculator.
H · Worked calculations (forecast funding, sensitivity, rounding)
H.1 Forecast funding: revenue 20,000,000 − direct cost 4,000,000 − expected loss 3,000,000 − fraud 500,000 − remediation 250,000 − capital charge 1,250,000 = risk-adjusted value 11,000,000. At a 5% pool rate, P = C = 550,000.
H.4 Sensitivity: with S = 1.05 and G = 1.00, W = 25% pays 250,000 and W = 22% pays 220,000, a 30,000 payable difference. Challenge the evidence before approving either matrix.
H.5 Rounding: full precision throughout; floor each department amount independently; within each employee pool, floor quotas and distribute leftover units by largest remainder and stable employee ID.
I · Glossary of body-to-business terms
| Body term | TCB™ meaning |
|---|---|
| Body | The organisation as an interdependent system |
| Organ | A department or function with a specialised role |
| Calories | A bounded variable reward pool |
| Organ weight | Structural size (headcount or FTE) |
| Activity | A product, service or lifecycle stage |
| Vital sign | A financial or non-financial indicator |
| Homeostasis | Monitoring and feedback; pay changes stay prospective |
| Injury / disease | A temporary failure / a persistent structural or cultural problem |
| Enlarged organ | A prompt to investigate capacity, not a staffing diagnosis |
| Health Gate | A published rule that reduces or blocks reward when defined harm occurs |
J · One-page summary of the model
Organ map explains roles → lifecycle map names what the product is doing → taxonomy and protocol produce prospective weights totalling 100% → data-confidence standard matches use to evidence → performance score measures controllable KPIs → Health Gates reduce or block harmful results → fixed ceilings contain each award → individual normalization reconciles exactly → governance controls conflicts, changes and appeals → staged validation tests the whole package.
M · Implementation decision rules (the hierarchy)
Law and regulation → approved compensation policy → Health Gates and readiness gates → pool and attribution rules → performance calculations → management judgement within approved tolerance.
Where local law, regulation, collective agreement or approved compensation policy imposes a higher standard, that standard governs. See the full go/no-go check in Chapter 13.
Toolkit
All Interactive Tools
Every working tool in this edition, each loaded with the book’s own example.
About the author
Abdullah Alzamil
Executive leader, entrepreneur, board member, executive coach and practical visionary.
After studying Information Technology in the United States, Abdullah returned to Riyadh and began his career in financial services. His early years in treasury, trading, structuring and client solutions taught him that creativity and discipline are not opposites.
Over more than two decades his responsibilities moved through treasury, structured products, Islamic banking, corporate transaction banking, digital channels, customer experience, enterprise strategy and business performance, including a C-suite role helping build a digital bank from the ground up. He became increasingly focused on the spaces between departments: where responsibility is shared, contribution is hard to measure, and no single function can succeed alone.
Outside the corporate world he has founded and supported technology and business ventures, served as a chairman and board member, and coached executives, entrepreneurs and startups.
The idea for TCB™ came into sharper focus during a performance-evaluation cycle in 2022. In 2023 he began developing a different way of looking at the problem. The human body offered the model: it does not value an organ by its size, visibility or position in a hierarchy, and the health of one part affects the health of the whole.
A personal note from the author
For several years, TCB existed only as an idea I carried with me. I eventually chose to share it because an idea cannot create value while it remains private. I present this book as a practical proposition and an invitation: to observe differently, question familiar assumptions, test what is useful and challenge what is incomplete.
Before building airplanes, we studied birds. Before building submarines, we studied fish. When building organizations, perhaps we should be willing to look again at the most sophisticated living system we already know.
“Perhaps the most important idea awakened by this book will not be mine. It may be the one it gives someone else the courage to share.”

ALZAMIL · ELEVATE YOUR BUSINESS
Interactive edition of TCB™ — The Corporate Body™, Revised Professional Edition 2026. © 2026 Abdullah Alzamil. All rights reserved. A conceptual model offered for discussion, pilot testing and improvement; not legal, financial, medical or HR advice.